
From its 2008 peak of Rs. 2,250, it crashed to a low of just Rs. 8.65 in 2020. But like a phoenix rising from the ashes, it soared back, touching Rs. 423 in 2025 marking an unbelievable recovery of nearly 4,800% from its low.
Is this a fresh beginning or a time to take money off the table?
While the turnaround story may be compelling for investors, but do the charts support the rally?
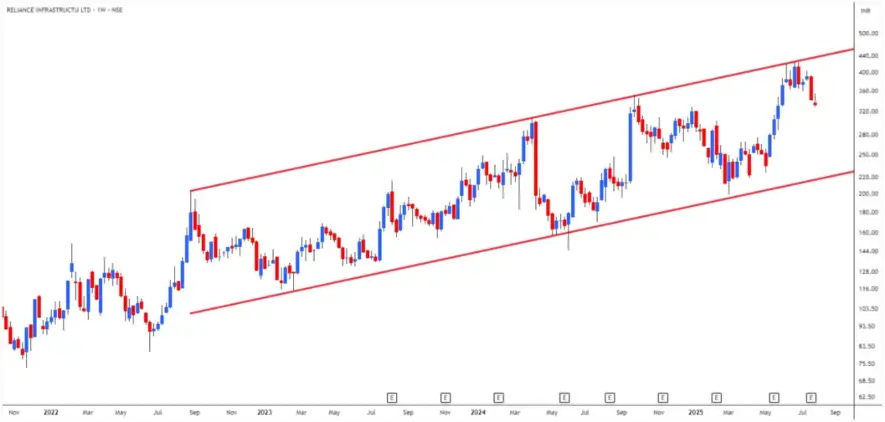
Weekly Chart 1
 Source: Tradingview
RelInfra has been trending upward within a three-year rising channel on the weekly time frame. The parallel lines act as a support (the lower band) and resistance (the upper band) levels.
Recently, the stock reached the upper boundary of this channel at Rs. 423, where it encountered significant resistance and the supply caused it to reverse the trend. Historically, the stock has reversed back to the lower band after testing the upper band. As per pattern, the stock price may potentially test the lower band placed at Rs. 250 zone.
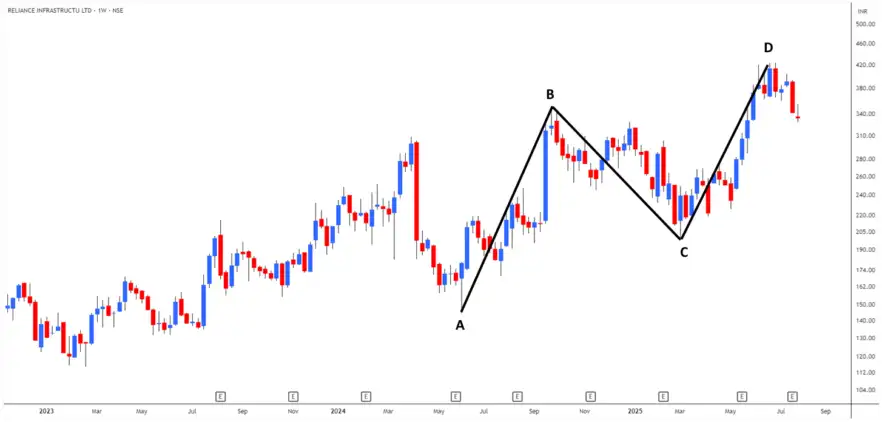
Weekly Chart 2
 Source: Tradingview
Adding to this cautionary tale, a Bearish AB=CD Harmonic Pattern has completed on the same weekly chart. Harmonic patterns use Fibonacci ratios to forecast price reversals and they are known as trend reversal patterns.
The AB=CD completion aligns with the recent peak, reinforcing the possibility that the bullish trend is pausing, if not ending. When combined with the rising channel's upper resistance, the harmonic pattern gives another bearish clue.
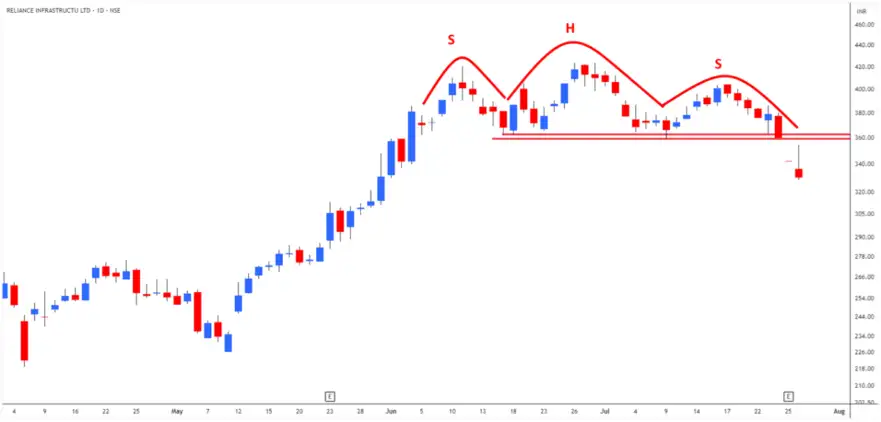
Daily Chart
 Source: Tradingview
Zooming into the daily chart, another textbook reversal signal, the Head and Shoulders pattern is visible. Formed around the Rs. 423 marks, this pattern is one of the most reliable indicators of a trend reversal from bullish to bearish.
As the price broke below the neckline, it confirms the reversal and potentially pushes the price downward toward the Rs. 250 zone, echoing the weekly chart's warning.
What Should Investors Do Now?
The fundamentals, debt restructuring plans, or sector outlook may have changed in favour of RelInfra, but the technical studies suggest that the risk-reward may not currently favour fresh buying unless the stock breaks and sustains above the Rs. 450 level, negating the bearish setup and considered as a potential resumption of the trend.
Disclaimer
Note: The purpose of this article is only to share interesting charts, data points and thought-provoking opinions. It is NOT a recommendation. If you wish to consider an investment, you are strongly advised to consult your advisor. This article is strictly for educative purposes only.


No comments:
Post a Comment