


👉After volatility in the first half, the Nifty 50 gained strength in the second half of December 5, rising one percent on the hope of a dovish tone from the RBI policy outcome due on December 6. The index hit the upper band of the Bollinger Bands on a weekly basis with above-average volumes, and the momentum indicators, RSI and MACD, maintained an upward bias on the daily charts. Hence, the Nifty may target 24,900-25,000, as long as it holds 24,700 on the RBI policy day. However, if it falls below this level, 24,500 is the immediate support, followed by 24,350 as the next support, according to experts.

👉Levels For The Nifty50 (24,708)Resistance based on pivot points: 24,835, 24,968, and 25,183Support based on pivot points: 24,406, 24,273, and 24,058The Nifty 50 formed a bullish candlestick pattern with a lower shadow on the daily charts, signaling buying interest at lower levels while holding above all key moving averages. The index surpassed the middle band of the Bollinger Bands intraday on a weekly basis but finished just below it. The momentum indicators RSI (Relative Strength Index at 60) maintained a positive bias, while the MACD (Moving Average Convergence Divergence) climbed above the zero line, which is a positive sign. 👉Levels For The NiftyBank(53,604)Resistance based on pivot points: 53,844, 54,089, and 54,485Support based on pivot points: 53,051, 52,806, and 52,410Resistance based on Fibonacci retracement: 54,467, 55,746Support based on Fibonacci retracement: 52,920, 52,315
The NiftyBank also formed a bullish candlestick pattern amid volatility, recovering sharply from the day's low to end with a 0.63 percent gain. The index maintained higher tops and higher bottoms on the daily timeframe for three days in a row and traded at the upper end of the Bollinger Bands on both the daily and weekly charts. The momentum indicators RSI (at 66) and MACD maintained an upward bias, and a robust bullish candlestick pattern formed in the index on the weekly scale.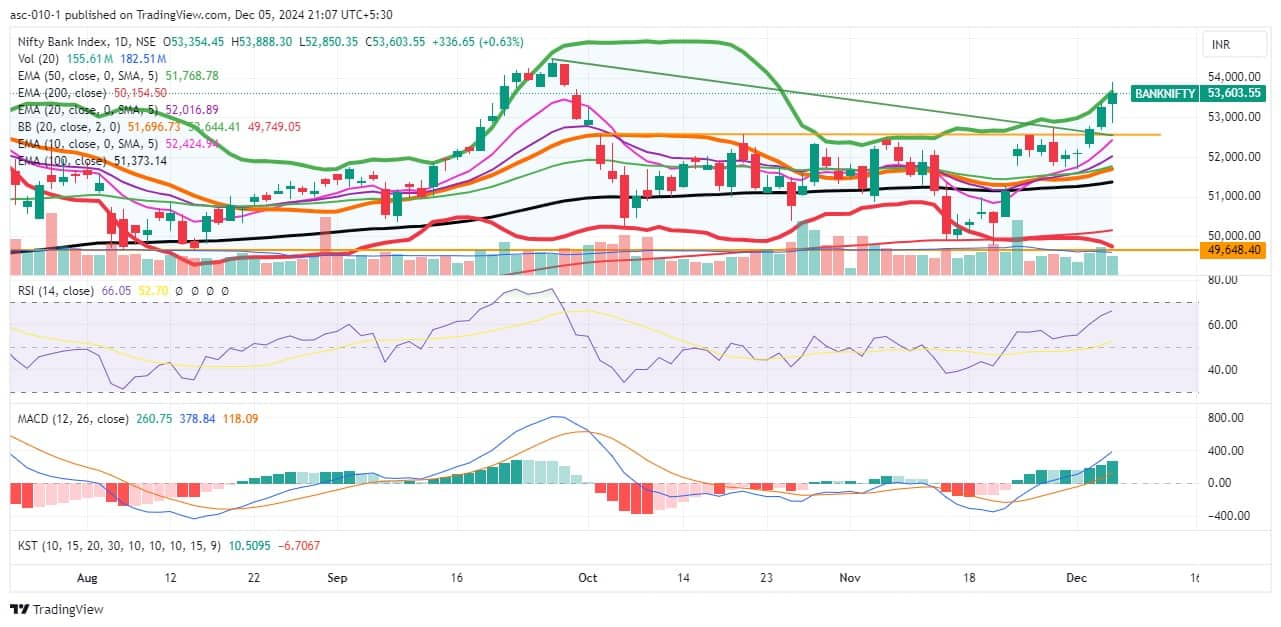
--------------------------------------------


No comments:
Post a Comment