
NIFTY50
- January Futures: 23,795 (▲0.2%)
- Open interest: 5,06,044 (▲1.7%)
The NIFTY50 index snapped its two day losing streak and ended the Tuesday's session on a positive note. The index formed a inside candlestick pattern on the daily chart, resembling the bullish harami pattern.
A bullish harami is a two-candlestick pattern which consists of a large bearish candle followed by a smaller bullish candle. The body of the smaller candle is entirely within the range of the previous candle. However, the pattern gets confirmed if the close of the subsequent candle is above the high of the reveral pattern.
The broader technical structure of the index remains bearish, with immediate resistance positioned around the 23,850-24,000 zone. For the bulls to shift the trend, reclaiming these levels is crucial. Conversely, a breakdown below 23,500 could intensify the decline, targeting the critical support zone near 23,300.

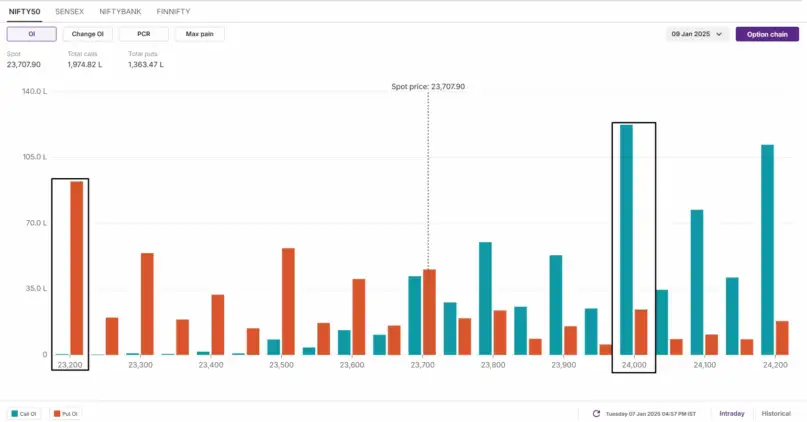
The open interest positioning of the index for 9 January expiry remains in favour of bears with significant call base at 24,000 and 24,100 strikes. This indicates that market participants are expecting index to take resistance around this zone. On the flip side, the put base was seen at 23,200 and 23,500 strikes with relatively low volume, suggesting support for the index around these levels.
Levels For The NiftyBank (50,202)
Resistance based on pivot points: 50,389, 50,502, and 50,685
Support based on pivot points: 50,024, 49,911, and 49,728
Resistance based on Fibonacci retracement: 50,730, 51,332
Support based on Fibonacci retracement: 49,289, 47,862
The NiftyBank has also formed an Inside Bar candlestick pattern on the daily timeframe but remains below all key moving averages, including the 200-day EMA (of 50,490), signaling a negative trend. The index is positioned near the lower end of the Bollinger Bands, while the RSI (at 37.3) remains in the lower band and the MACD is below the zero line, further signaling weakness.
SENSEX
- Max call OI: 80,000
- Max put OI: 76,000
- (Expiry: 14 Jan)
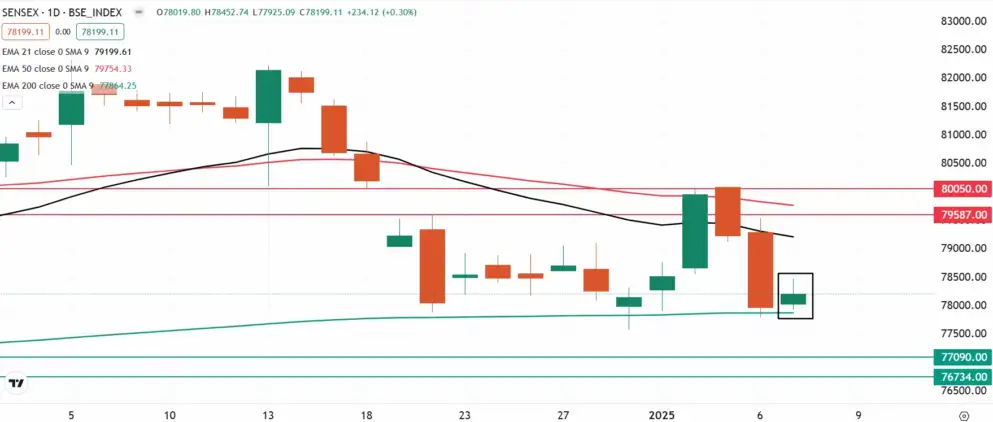
The SENSEX recouped some of its minor losses on the weekly expiry of its options contracts and ended Tuesday's session in the green. The index formed an inside candlestick pattern on the daily chart around the crucial support of 200 EMA.
On the daily chart, the index is trading near its 200 EMA, a psychologically significant support level. In the coming sessions, a close below the low of January 6 could extend the weakness towards the 76,700 zone. Conversely, if the index reclaims the immediate resistance near 79,000, the trend may shift in favor of the bulls.
FII-DII activity
On January 7, Foreign Institutional Investors (FIIs) offloaded shares worth ₹1,491 crore, continuing their selling streak. In contrast, Domestic Institutional Investors (DIIs) stepped in as net buyers, accumulating shares worth ₹1,615 crore. To track the ratio of long and short open positions of FIIs in the index, log in to https://pro.upstox.com/ ➡️F&O➡️FII-DII Activity➡️FII Derivatives.
------------------------------------------------
👉U.S. indices closed Tuesday's session in the red as stronger-than-expected economic data reignited fears of persistently high inflation in 2025. The manufacturing PMI showed an expansion last month, climbing to a two-month high of 64.4 from 58.2.
Meanwhile, job openings exceeded expectations in November, with data revealing 8.1 million openings, up from 7.8 million in October - the highest level since May 2023.

No comments:
Post a Comment