SENSEX
- Max call OI: 79,000
- Max put OI: 76,500
- (Expiry: 21 Jan)
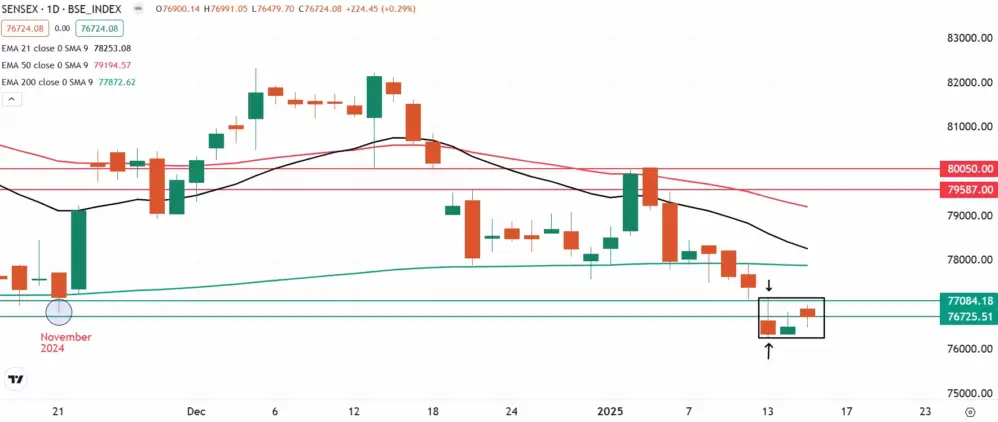
The SENSEX extended its range-bound movement for the second day in a row and consolidated within the range of 13 January. The index formed an inverted hammer candlestick pattern on 13 January and has formed a second inside candle.
The technical structure of the index as per the daily chart remains weak with immediate resistance around the 78,000 mark. The zone also coincides with the 200-day EMA of the index. However, traders should also closely monitor the high and the low of inverted hammer. A close above the high or below the low of the reversal pattern will provide further directional clues.

The Nifty 50 remained in positive territory amid choppy trade, rising 0.2 percent and extending its uptrend for the second consecutive session on January 15. The Nifty 50 is expected to trade in the range of 23,050–23,350 (Monday's low and high) in the near term, while overall sentiment remains in favour of bears until the index closes above all key moving averages. If the index decisively breaks the lower end of the range, a fall toward 22,800 could be possible. However, if it moves above the upper range, the index may climb toward the 10-day EMA of 23,460 and then the 200-day EMA of 23,680, according to experts.
Levels For The Nifty50 (23,213)
Resistance based on pivot points: 23,274, 23,309, and 23,365
Support based on pivot points: 23,162, 23,127, and 23,070
More on Nifty50:
- January Futures: 23,265 (▲0.0%)
- Open interest: 5,41,452 (▼1.5%)
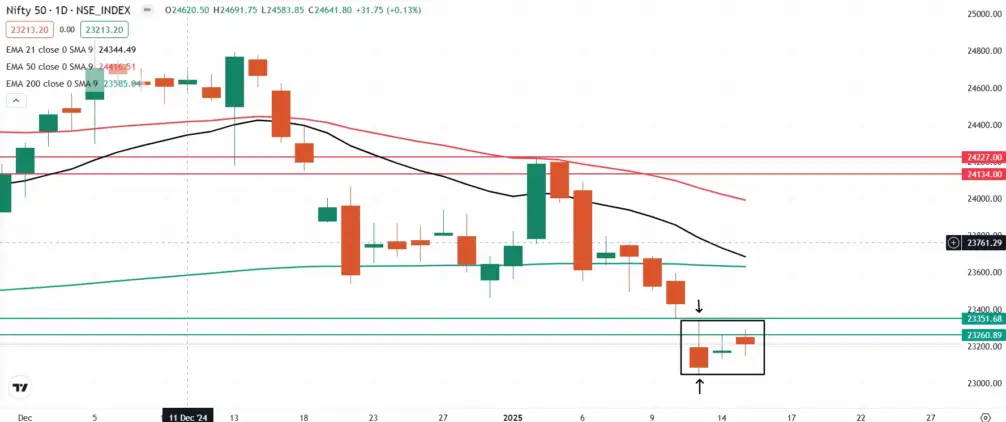
The NIFTY50 index extended its upward climb on January 15 and ended the day with moderate gains. The index formed a second consecutive inside candle on the daily chart, signalling consolidation around the 23,200 zone.
As per the daily chart, the broader trend of the index remains weak with immediate resistance around 23,700 zone, which coincides with its 200- day exponential moving average (EMA). Meanwhile, positional traders can monitor the high and low of the inverted hammer formed on 13 January. A close above or below the high and low of the reversal pattern will provide further directional clues.

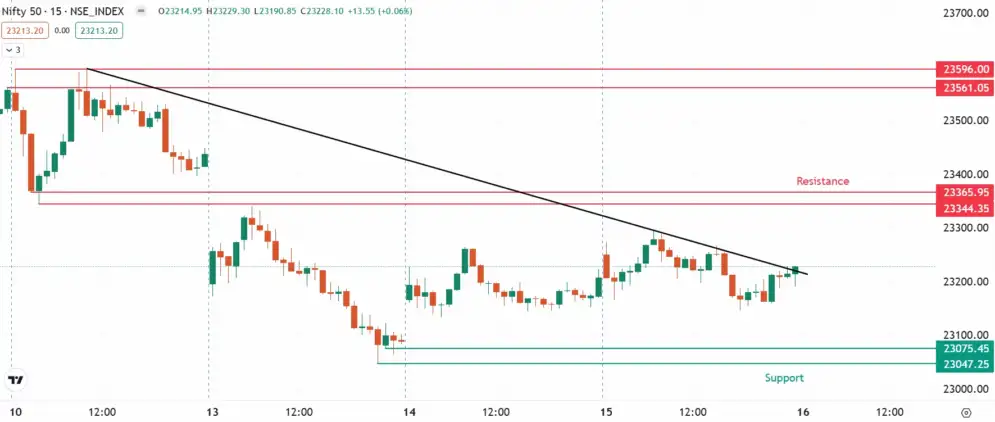
On the 15-minute chart, traders can monitor the resistance zone of 23,350 and a downward sloping trendline. A close above the resistance zone on a 15 minute chart with a strong candle, will signal the momentum extending towards the resistance zone of 23,500. On the flip side, the immediate support is visible around the 23,000 zone.

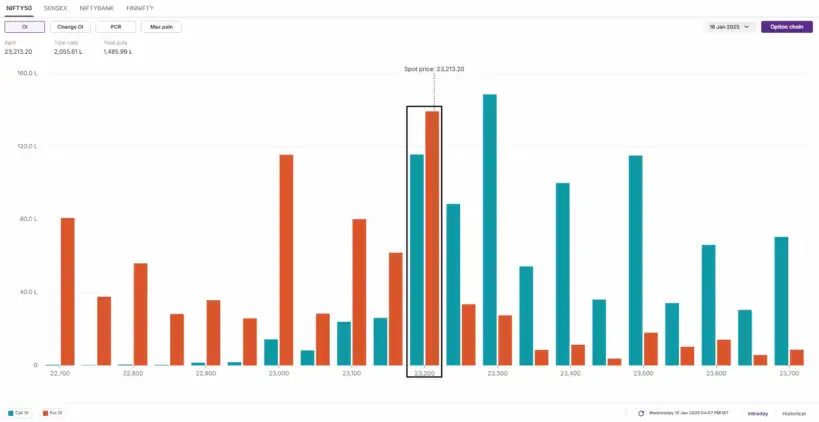
The open interest data for the today's expiry saw significant call and put base at 23,200 strike, signalling consolidation around this zone. Meanwhile, a substantial call and put base was also established at 23,300 and 23,000 strikes, signalling resistance and support around these levels.

-------------------------------------------------
Levels For The Nifty Bank (48,752)
Resistance based on pivot points: 49,000, 49,133, and 49,347
Support based on pivot points: 48,572, 48,439, and 48,225
Resistance based on Fibonacci retracement: 49,448, 50,407
Support based on Fibonacci retracement: 47,874, 46,078
-----------------------------------------------
👉FII-DII activity
Foreign Institutional Investors (FIIs) extended their selling streak for the ninth consecutive session, offloading shares worth ₹4,533 crore. Meanwhile, Domestic Institutional Investors (DIIs) continued their buying trend, purchasing shares worth ₹3,682 crore.
👉U.S. indices rallied on Wednesday as the consumer inflation data showed that key prices rose less than expected in December. The Consumer Price Index rose 2.9% year-on-year, in line with street estimates. Moreover, the core CPI, which strips out volatile food and energy prices, came in at 3.2%, slightly better than estimates of 3.3%.
Wall Street was also cheered the better-than-expected third-quarter earnings of banks. Investment banking and trading revenues contributed to the well-received results from JPMorgan Chase, Goldman Sachs, Citigroup and Wells Fargo.
source: TradingView, upstox,Network18,
& vali
---------------------------------------


No comments:
Post a Comment