
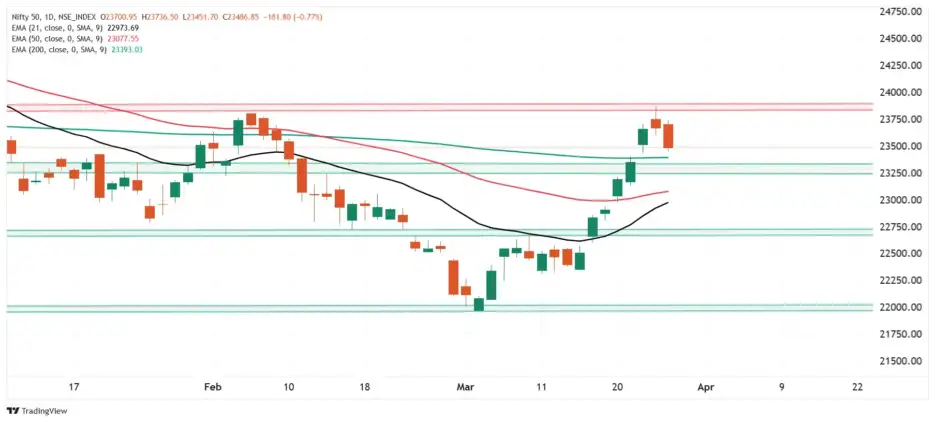
The NIFTY50 index saw profit-taking for the second consecutive day, snapping its seven-day winning streak. The index formed a bearish candle on the daily chart, closing below the doji candlestick pattern formed on the March 25th.
The index maintains a bullish structure on the daily chart, trading above key exponential moving averages (21, 50 and 200). These levels will act as immediate support. However, with the uncertainty surrounding the U.S. reciprocal tariffs to be announced on April 2nd, profit-taking has taken place near the 23,800 area - the February swing high - which now acts as immediate resistance.
Intraday range
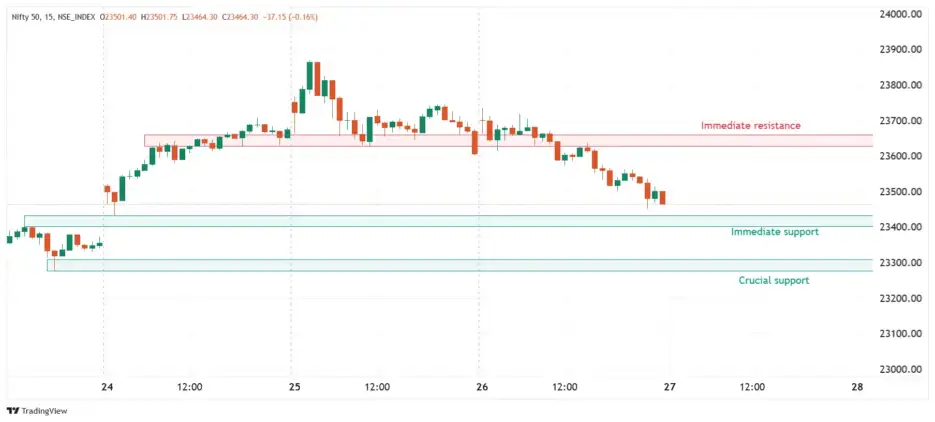
On the 15-minute chart, the NIFTY50 index faces immediate resistance near 23,650 and support around 23,400. An open above or below these levels will provide traders further directional clues. Meanwhile, a drop below the key 23,200 support would signal weakness.
Options build-up
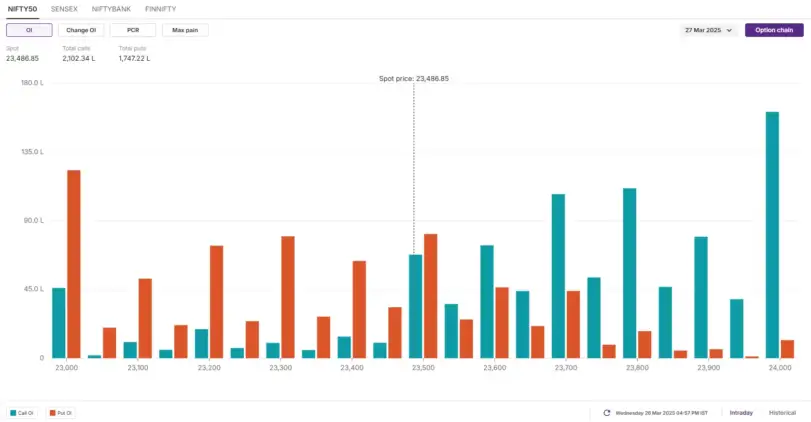
The open interest (OI) data for the March 27th expiry saw significant call build-up at 23,800 and 23,700 strikes, pointing to resistance for the index around this zone. On the other hand, the put base was observed at 23,300 and 23,200 strikes, suggesting support for the index around these levels. Additionally, 23,500 call and put options also witnessed significant OI build-up, indicating range-bound activity around this level.
Bearish outlook
Traders anticipating a break below the 23,400 zone can consider a long put strategy to capitalise on the bearish outlook. Buying an ATM put option with a 23,500 strike price would set the breakeven point at 23,429. This means the strategy will turn profitable if the NIFTY50 index declines by 0.2%.
Range-bound outlook
Traders anticipating a range-bound movement on the NIFTY50 with option build-up and base around 23,500 can plan an iron condor strategy. If you believe that the NIFTY50 index will remain stable and between the short put and short call strike prices, you'll earn the maximum profit.
Conclusion
In simple terms, a long call strategy allows traders to take advantage of rising prices, while a long put takes advantage of falling prices. Options offer the flexibility to navigate different market conditions - bullish, bearish or range-bound. However, past performance isn't a guarantee of future results. Before implementing any strategy, it's important to assess the risks and have a clear plan for managing potential losses.
Levels for Nifty50:
Resistance based on pivot points: 23,667, 23,734, and 23,843
Support based on pivot points: 23,450, 23,382, and 23,274
The Nifty 50 formed a long bearish candlestick pattern on the daily charts, indicating a potential negative trend ahead. However, the index still sustained above all key moving averages (10, 20, 50, 100, and 200-day EMAs), with short-term moving averages crossing above medium-term moving averages on the daily scale. The momentum indicator RSI (Relative Strength Index) is at 50.2 and has been inching upward on the weekly scale.
Levels For The Nifty Bank (51,209)
Resistance based on pivot points: 51,693, 51,883, and 52,191
Support based on pivot points: 51,076, 50,886, and 50,578
Resistance based on Fibonacci retracement: 51,883, 53,020
Support based on Fibonacci retracement: 50,273, 49,283
The NiftyBank also formed a bearish candlestick pattern on the daily timeframe, but the trend remains upward, as the index traded above all key moving averages. Short-term moving averages have crossed above medium and long-term moving averages, and the Bollinger Bands remain in expansion mode. On the weekly scale, the momentum indicators RSI is at 55.08 and is trending higher, while the MACD saw a positive crossover (though it is still below the zero line).
source: Upstox, Trading View & Sunil Shankar Matkar


No comments:
Post a Comment