
SENSEX
chart for1/4/25
----------------------------------------

Max Call OI:78,000
Max Put OI:76,500
(Ten strikes to the ATM, 1st April Expiry)
SENSEX managed to close the previous week in green with 0.72% gains amid facing selling pressure at higher levels. The index faced resistance at the previous swing high level of 78,740. The index continued its gains at the start of the week but later fell due to selling pressure by the FIIs on Friday, 28th March 2024. Tariff concerns, cautious outlook on earnings season, and some profit booking at higher levels weighed down on the sentiments
On the technical side, similar to NIFTY50, the index faced resistance at 50 WMA of 78,430 on the weekly charts. However, the 200 EMA on the daily charts remains the key support level for the index for the coming week. Experts sound cautious on the technical outlook of the index, as failure to close above the previous week's high level could indicate a reversal in the trend pattern from bullish to bearish. 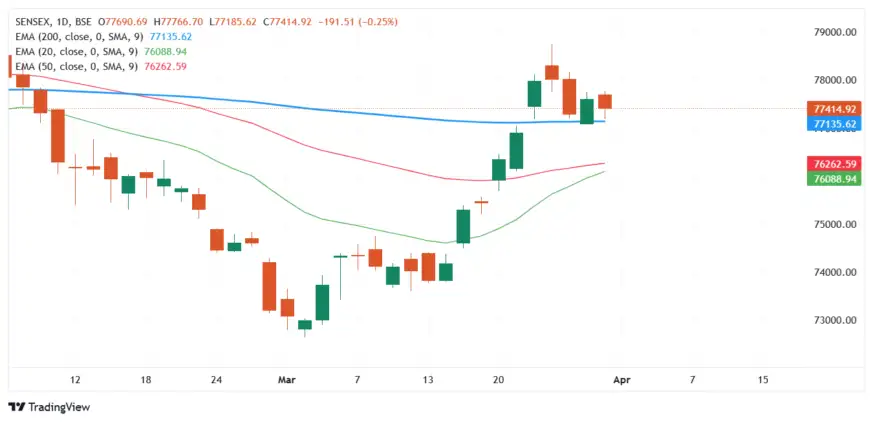
On the open interest (OI) front, the 78,000 level remains the key resistance with the highest open interest for the current week's expiry. Similarly, 76,500 remains the key support level with the highest OI.
Foreign Institutional Investors (FIIs) snapped their buying streak on the sevent day as they sold Indian equities worth ₹4,352 crore. On the flip side, Domestic Institutional Investors (DIIs) bought equities worth ₹7,646 crore on Thursday.

Max call OI:24,000
Max put OI:23,500
( Ten strikes to ATM, 3rd April Expiry)
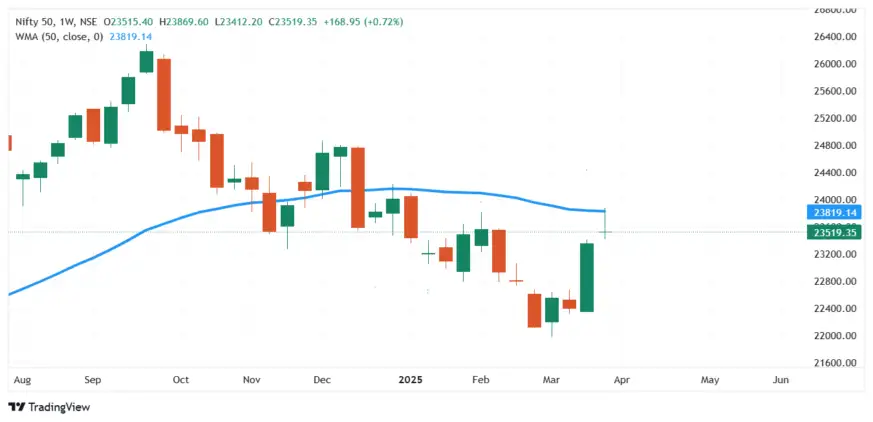
NIFTY50 continued its bullish momentum for the second week in a row after bouncing back from lower levels. NIFTY50 managed to close in green after facing resistance at the previous swing high levels of 23,800, levels last touched in February 2024. The selling pressure at higher levels was primarily driven by anxiety about tariff impact of impending reciprocal tariff announcements by the US President. In addition, experts believe that profit booking at higher levels also added some pressure on the benchmark index.
On technical charts, the index formed a gravestone doji chart pattern on a weekly basis. In addition, the benchmark index also faced resistance at 50 WMA (weighted moving average) levels of 23,834, indicating a cool-off in the existing bullish trend and a reversal to a bearish trend.
Nifty 50 slipped into weakness amidst range movement on March 28 and closed the day lower by 72 points.
"A reasonable negative candle was formed on the daily chart, which indicates an inability of bulls to continue with follow through upmove. The present chart pattern signals chances of range bound action developing within a high low of around 23,650 - 23,400 levels. Nifty 50 on the weekly chart formed a small candle with a long upper shadow. Technically, this market action indicates a formation of doji type candle pattern (type of gravestone doji -not a classical one). This market action suggests more consolidation for the short term," said Nagaraj Shetti, Senior Technical Research Analyst at HDFC Securities.
According to him, the near-term uptrend of Nifty 50 remains intact and the downward correction from the highs has not damaged the underlying uptrend so far.
"Immediate support is placed at 23,400 - 200-day Exponential Moving Average (EMA) - and the overhead resistance to be watched around 23,650 levels and next 23,850 for this week," Shetti said.
Om Mehra, Technical analyst, SAMCO Securities, highlighted that the Nifty 50 index remained resilient on a weekly basis and gained 0.72%, and posted a strong monthly return of 6.30%.
"On the daily chart, Nifty exhibits a higher high and higher low formation, strengthening its bullish momentum. The index is comfortably positioned above the 20, 50, and 100 EMAs, while the daily RSI remains steady above the 60 mark, indicating sustained strength. The support levels include the 23.6% Fibonacci retracement at 23,500, offering minor support, while a more substantial cushion is placed at the 38.2% retracement level at 23,280. Nifty may consolidate for some time before making its next decisive move," said Mehra.
According to Hrishikesh Yedve, AVP Technical and Derivatives Research at Asit C. Mehta Investment Interrmediates Ltd., Nifty 50 respected the 100-Days EMA support near 23,400 and formed a red candle on the daily chart. However, on the weekly scale, the index formed a doji candle, indicating uncertainty.
"Nifty 50 index continues to face resistance in the 23,800 - 23,810 zone, and a decisive move above 23,810 could extend the rally towards 24,000 - 24,080, where the 200-Day Simple Moving Average (200-DSMA) is positioned. On the flip side, sustaining below 23,400 could lead to further weakness towards 23,200 - 23,000 levels. Traders should monitor these levels for potential trading opportunities," said Yedve.
VLA Ambala, Co-Founder of Stock Market Today, noted that the Nifty 50 formed a gravestone doji candlestick pattern on the weekly chart, which indicates a negative sentiment if it closes below 23,390.
"According to the market analysis, the 23,350 to 23,400 range can be considered as a key for market movements and trading strategy in the upcoming week. In intraday trade, Nifty might expect support between 23,415 and 23,300, while resistance can be found near 23,600 and 23,670. However, with a long weekend, any significant gap opening or gap can affect market trends differently," Ambala said.
On daily charts, NIFTY50 continues to trade above its short, medium and long term averages despite facing selling pressure at higher levels. Experts and Analysts believe the bearish chart pattern on the weekly charts could be negated if the NIFTY50 manages to close above the swing high levels of 23,860 in the coming week. 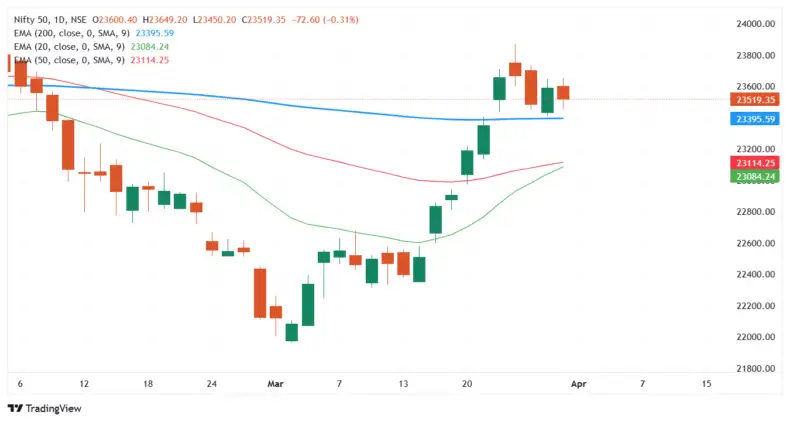
On the options contract level, the 3rd April expiry contracts indicate 24,000 strike as the resistance level for NIFTY50 with the highest open interest. Similarly, 23,500 remains the key support level for the index with the highest open interest.

Nifty Bank index ended 11.00 points, or 0.02%, lower at 51,564.85 on Friday, forming a small red candle, while on the weekly scale, it registered a green candle, reflecting underlying strength.
"Nifty Bank index continues to hold above the 200-DSMA, reinforcing a positive outlook. On the upside, 51,850 and 52,000 are key resistance levels, and a sustained move above 52,000 could trigger further upside. Traders should maintain a 'buy on dips' strategy for Bank Nifty as long as the index stays above the 200-DSMA support of 51,000," said Hrishikesh Yedve.
Om Mehra believes that the broader trend remains firmly bullish, as the Bank Nifty index holds above all key moving averages.
"After a strong upward trajectory, Nifty Bank appears poised for a healthy consolidation, which could establish a solid support base before its next leg higher. The support remains at 51,000. while resistance stands at 52,100. A buying on dips remains a viable strategy for the upcoming session," Mehra said.
Bajaj Broking Research said in a note that the Nifty Bank index formed a high wave candle signaling consolidation amid stock specific action.
"Going ahead, we expect the index to extend the last four session consolidation in the broad range of 52,000 - 50,500 thus forming a base for the next leg of up move and in the process work off the overbought condition developed in the daily stochastic," said Bajaj Broking Research.
The brokerage firm believes the current breather should be used to accumulate quality banking stocks as we expect the index to sustain above the recent major breakout area of 50,500 and gradually head towards 53,000 levels in coming weeks being the measuring implication of the last 10 weeks range breakout.
The US markets closed in green on Monday amid a whipsaw movement in the benchmark indices. The US markets opened up 1% lower on Monday on the Dow Jones, S&P500 and NASDAQ and closed in green on the S&P500 and Dow Jones, while NASDAQ closed with little losses. The volatility heightened as investors navigated through economic growth concerns amid escalated trade tensions.
Despite the green closing, attention remains on the tariff announcements on April 2. Some experts believe the extent of reciprocal tariffs could be less than feared. However, despite the magnitude of the tariff, the announcements will remain the key trigger for markets for the coming week.


No comments:
Post a Comment