

The market closed flat for the third consecutive session on May 2, after witnessing significant pressure at higher levels due to elevated VIX amid geopolitical tension between India and Pakistan. A healthy trend remains intact, given that the benchmark Nifty 50 stayed above all key moving averages. In the upcoming sessions, the index may trade in the range of 24,000–24,600 (around the previous week's high-low). A decisive breakout above the upper range can take the index toward 24,860 (the December 2024 swing high), while a breakdown below the lower range can drag it down to 23,850 (the recent swing low)
Levels for Nifty50:
Resistance based on pivot points: 24,525, 24,608, and 24,742
Support based on pivot points: 24,257, 24,175, and 24,041
The Nifty 50 formed a small bullish candle with a long upper shadow on the daily charts, indicating pressure at higher levels, while the volume was above average. The index made a healthy attempt to surpass the 61.8 percent retracement level (24,550) last Friday. It traded well above all key moving averages, with all EMAs (10, 20, 50, 100, and 200-day) trending upward. Notably, the 50-day EMA is on the verge of crossing above the 200-day EMA—a golden crossover—which, if confirmed, signals a strong trend ahead. The RSI (Relative Strength Index) sustained above 60, at 65.18, and the MACD (Moving Average Convergence Divergence) continued trending upward.
Levels For The Nifty Bank (55,115)
Resistance based on pivot points: 55,534, 55,698, and 55,965
Support based on pivot points: 55,001, 54,836, and 54,570
Resistance based on Fibonacci retracement: 56,307, 58,648
Support based on Fibonacci retracement: 54,117, 52,891
The Nifty Bank formed a Doji-like candlestick pattern on the daily charts, indicating indecision among bulls and bears. On the weekly timeframe, a bullish candle with a long upper shadow was observed, signaling pressure at higher levels. However, the index traded above all key moving averages on both daily and weekly scales. The RSI remained above 60, at 67.16, but showed a negative crossover. The MACD maintained a positive crossover but trended downward.
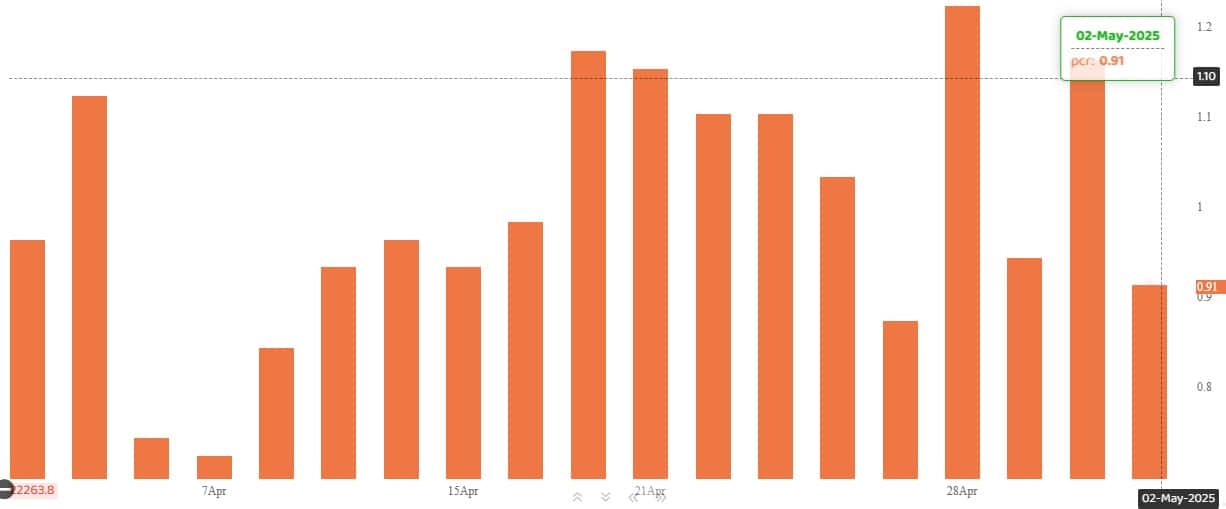
PUT-CALL RATIO :
The Nifty Put-Call ratio (PCR), which indicates the mood of the market, dropped sharply to 0.91 on May 2, from 1.16 in the previous session.
The increasing PCR, or being higher than 0.7 or surpassing 1, means traders are selling more Put options than Call options, which generally indicates the firming up of a bullish sentiment in the market. If the ratio falls below 0.7 or moves towards 0.5, then it indicates selling in Calls is higher than selling in Puts, reflecting a bearish mood in the market.
India VIX
India VIX, the fear gauge, remained elevated above the 18 mark, closing at 18.26 on May 2—up 0.19 percent. It continued to sustain well above all moving averages, signaling further caution for bulls.


No comments:
Post a Comment