
The Nifty IT index dragged the Nifty50 in July registering a fall of 9.70%.
The giants of the IT index, like HCL Tech (-15.08%), Persistent (-14.58%), and TCS (-12.28%), led the downward spiral. In fact, MPHASIS was the lone bright spot, with a gain of 0.06%.
While July’s performance came as a disappointment, seasonality analysis suggests that August could offer a much-needed recovery for tech stocks.
Seasonality analysis is a method to understand how an asset typically performs during specific months or periods of the year.
Nifty IT Seasonality Index
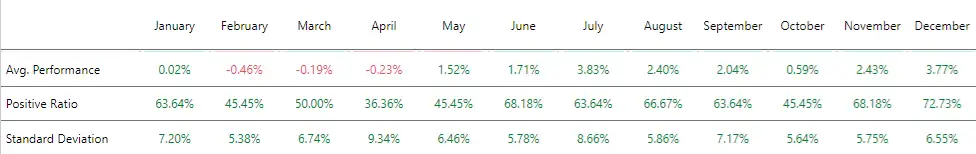 Source: RZone, Definedge
In August, the Nifty IT index had an average return of 2.40%. The returns are with a 67% strike rate, meaning in two out of every three years, August has closed in the green.
But we are not relying only on seasonality; the technical charts are also showing promising signs.
Nifty IT Weekly Chart
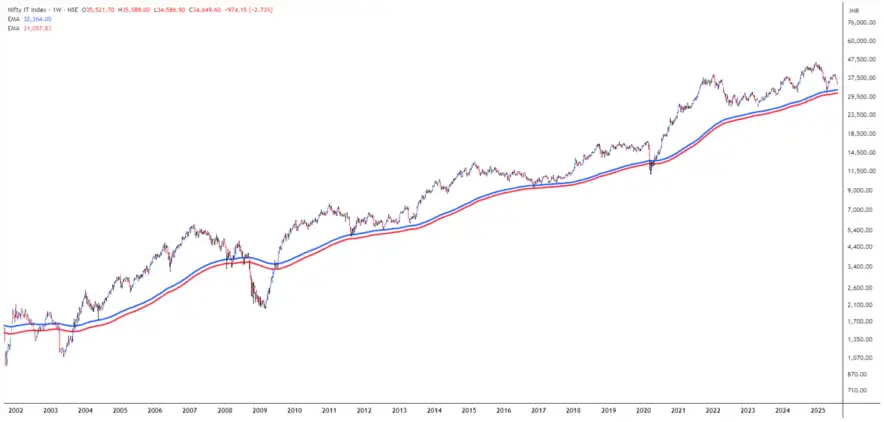 Source: Tradingview
The weekly chart of the Nifty IT index shows that a critical technical support level at the 262-week exponential moving average (WEMA) channel, calculated using both the high and low values of 262WEMA, has once again come into play.
Historically, this channel has served as a demand zone for the IT sector. In the last couple of decades, the index has breached below this zone in 2003, 2008, and 2020 and each coinciding with broader market panic situations. The index reversed from this zone in April 2025, marking it as an important support once again.
The current retracement may be a potential buying opportunity for bulls who are focused on medium-to-long-term horizons.
Seasonality Analysis of Nifty IT Constituents
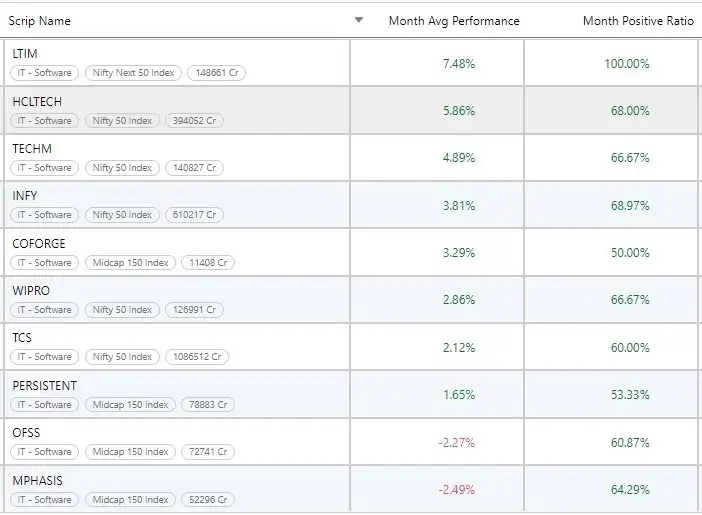 Source: RZone, Definedge
LTIMindtree (LTIM) leads the table with consistent positive returns. Still, the giants like Infosys and TCS which together command a 51% weightage in the Nifty IT index will have a disproportionate impact on the broader index.
Infosys Weekly Chart
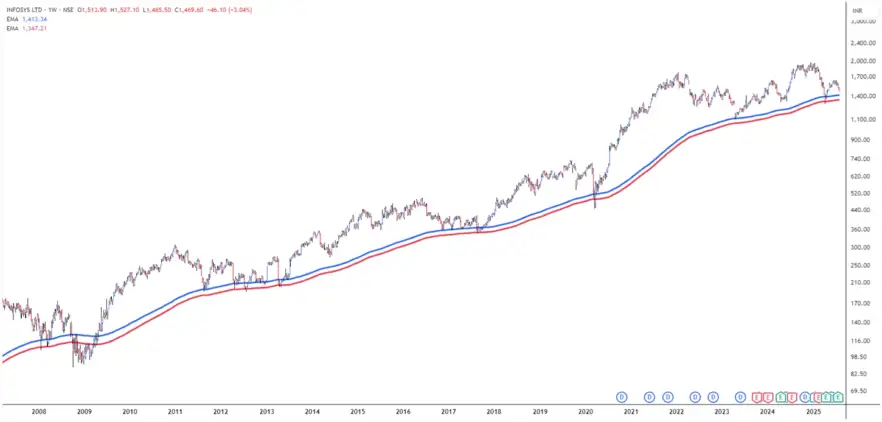 Source: Tradingview
Infosys has historically respected the 262WEMA channel. During the COVID-19 crash in 2020, the stock fell sharply but found support in this very channel, from where it staged a remarkable recovery. Interestingly, the stock is once again hovering around this support.
If the past is any guide, such levels have often turned out to be turning points for the stock. The retracement in July has brought the stock back into this historically proven demand zone and any reversal in Infosys may lift the Nifty IT index.
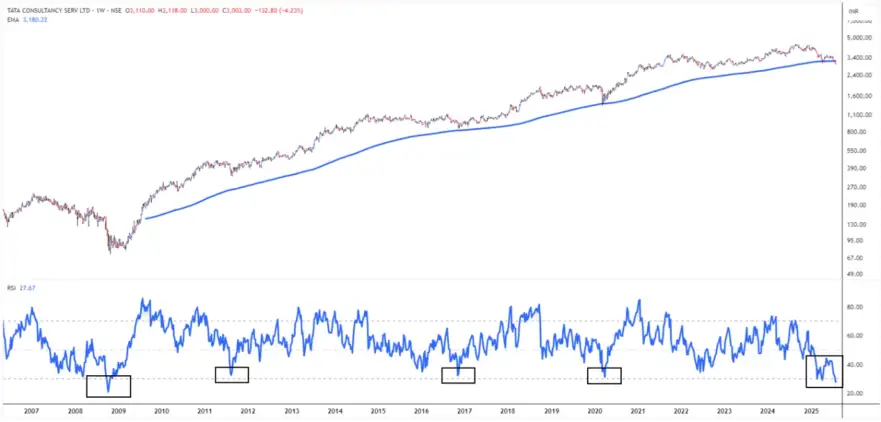
TCS Weekly Chart
 Source: Tradingview
The Relative Strength Index (RSI) on the weekly chart has slipped below 35, which has acted as the caution zone for bears. This is only the fifth instance since 2008 that the TCS has seen such a low RSI reading. On all previous occasions, TCS has offered good medium-term reversal opportunities after such oversold conditions.
Additionally, TCS is hovering near its long-term moving average of 200WEMA. The average has historically acted as a support level to the stock price. The convergence of an oversold RSI and 200WEMA indicates a potential reversal zone.
Can History Repeat in August?
The stock market tends to rhyme with the past, if not repeat exactly. August has historically been favourable for the IT sector and when it aligns with strong technical levels, the probability of a reversal increases manifold.
With Infosys and TCS making up over half of the Nifty IT index, any reversal in these stocks can potentially restore market sentiment. With seasonality in favour and technical showing strength, August 2025 might be the month when Indian IT regains its lost mojo.
Disclaimer
Note: The purpose of this article is only to share interesting charts, data points and thought-provoking opinions. It is NOT a recommendation. If you wish to consider an investment, you are strongly advised to consult your advisor. This article is strictly for educative purposes only.
As per SEBI guidelines, the writer and his dependents may or may not hold the stocks/commodities/cryptos/any other assets discussed here. However, clients of Jainam Broking Limited may or may not own these securities.
Kiran Jani has over 15 years of experience as a trader and technical analyst in India’s financial markets. He is a well-known face on the business channels as Market Experts and has worked with Asit C Mehta, Kotak Commodities, and Axis Securities. Presently, he is Head of the Technical and Derivative Research Desk at Jainam Broking Limited.
Disclosure: The writer and his dependents do not hold the stocks discussed here. However, clients of Jainam Broking Limited may or may not own these securities.
By Financial Express


No comments:
Post a Comment