

The Nifty 50 bounced back sharply after a day of selloff but closed off the day's high with gains of one-third of a percent on July 9. The formation of a bullish reversal-type pattern after a day of a long red candle has raised hopes for further recovery, provided the index defends the 23,800 support level and confirms the reversal with a rally in the following session. However, the overall market remains choppy in the short term. A sustained move above the 24,200–24,300 zone can bring bulls back into action. Until then, consolidation with range-bound trading may continue, with 23,800 acting as key support. Only a decisive fall below this level can increase the possibility of a downside move toward 23,600, according to experts.
Levels For The NIFTY50(cmp23,963
Resistance based on pivot points: 24,088, 24,137, and 24,217
Support based on pivot points: 23,928, 23,879, and 23,799
Special Formation: On the daily timeframe, the Nifty 50 formed a small bullish candle with a long upper shadow, resembling an inverted hammer-type pattern, after a day of a big red candle. Generally, the formation of such a pattern after a sharp fall is considered a bullish reversal signal, provided the index confirms it in the following sessions. The index closed above the 50-day EMA but failed to sustain above the 20-day and 100-day EMAs due to profit booking. The RSI rose to 50.43 but remained below the reference line. Meanwhile, the MACD is on the verge of a bearish crossover, with the histogram bar shrinking to almost the zero line. All this indicates that the index is at a crucial juncture, with confirmation from the next few sessions needed to determine the near-term direction.
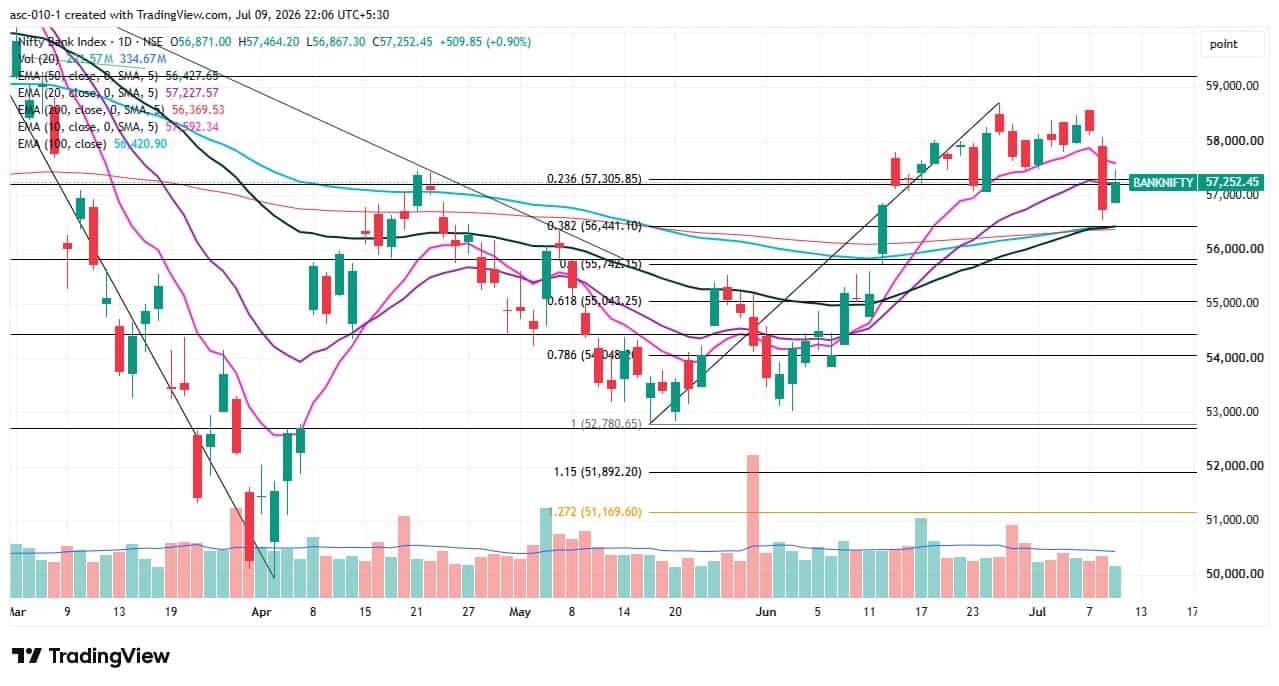
Levels For The NIFTY BANK (cmp57,252)
Resistance based on pivot points: 57,423, 57,564, and 57,792
Support based on pivot points: 56,967, 56,826, and 56,598
Resistance based on Fibonacci retracement: 59,195, 61,717
Support based on Fibonacci retracement: 56,441, 55,742
Special Formation: The Bank Nifty formed a bullish candle after a day of a long bearish candle on the daily charts, resembling a bullish harami candlestick pattern. This is generally considered a bullish reversal pattern but requires confirmation in the following sessions. The index closed above the 20-day EMA and sustained above its medium- and long-term moving averages. The RSI climbed to 52.7, though it remained below the reference line. However, the MACD maintained a bearish crossover, with the histogram extending its red bars for the third consecutive session. All this indicates that while the price action has turned positive, momentum indicators still warrant caution until further confirmation emerges.
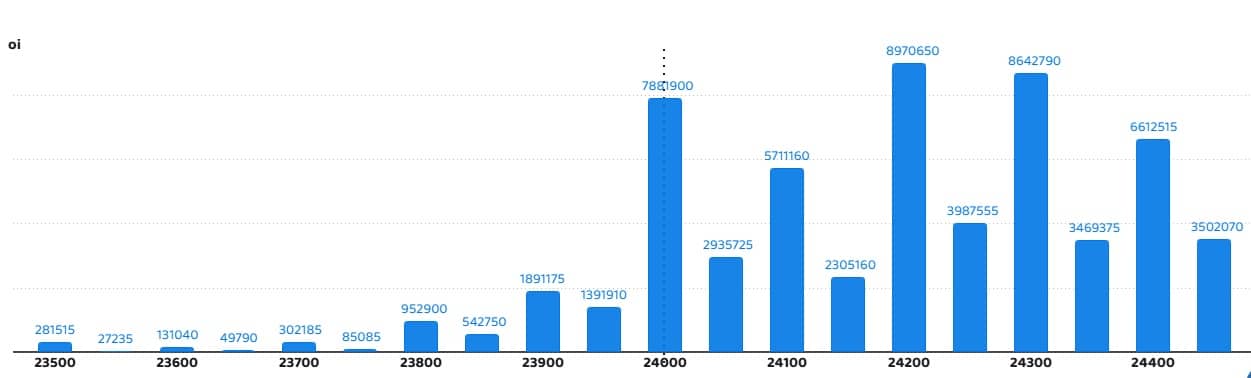
Nifty Call Option Data:
According to the weekly options data, the 24,200 strike holds the maximum Call open interest (with 89.7 lakh contracts). This level can act as a key resistance level for the Nifty in the short term. It was followed by the 24,300 strike (86.42 lakh contracts) and 24,000 strike (78.81 lakh contracts).
Maximum Call writing was observed at the 24,050 strike, which saw an addition of 17.94 lakh contracts, followed by the 24,100 and 24,000 strikes, which added 17.71 lakh and 16.89 lakh contracts, respectively. The maximum Call unwinding was seen at the 23,900 strike, which shed 11.14 lakh contracts, followed by the 24,200 and 24,250 strikes which shed 9.29 lakh and 7.89 lakh contracts, respectively.
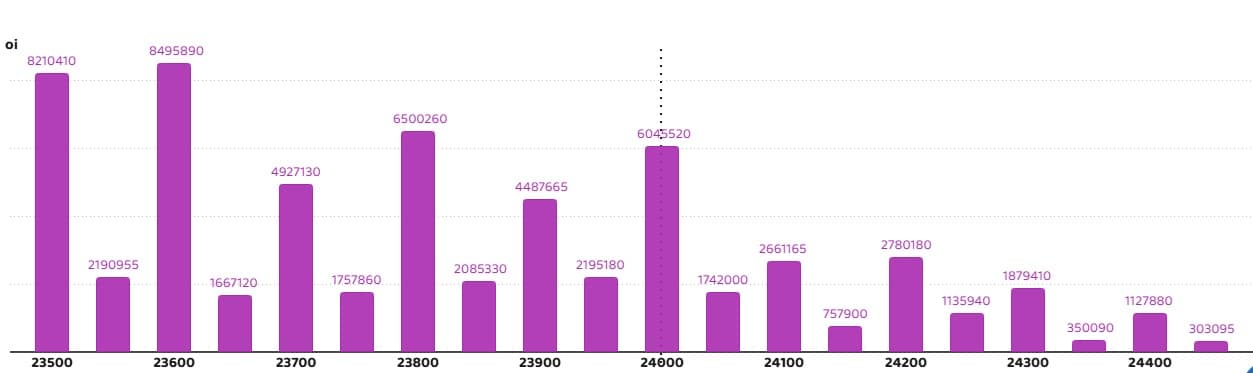
Nifty Put Option data:
On the Put side, the maximum Put open interest was seen at the 23,600 strike (with 84.95 lakh contracts), which can act as a key support level for the Nifty in the short term. It was followed by the 23,500 strike (82.1 lakh contracts) and the 23,800 strike (65 lakh contracts).
The maximum Put writing was placed at the 23,600 strike, which saw an addition of 33.68 lakh contracts, followed by the 24,000 and 23,500 strikes, which added 25.64 lakh and 25.36 lakh contracts, respectively. The maximum Put unwinding was seen at the 24,200 strike band which shed 10.67 lakh contracts, followed by the 24,300 and 24,250 strikes, which shed 5.52 lakh and 3.12 lakh contracts, respectively.
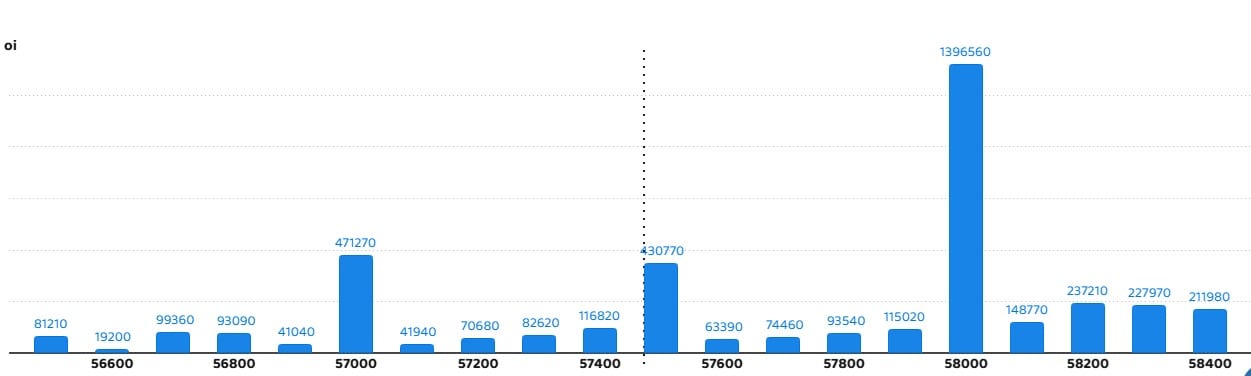
Nifty Bank Call option Data:
According to the monthly options data, the 58,000 strike holds the maximum Call open interest, with 13.96 lakh contracts. This can act as a key resistance level for the index in the short term. It was followed by the 57,000 strike (4.71 lakh contracts) and the 57,500 strike (4.3 lakh contracts).
Maximum Call writing was observed at the 57,500 strike (with the addition of 1.49 lakh contracts), followed by the 57,400 strike (75,570 contracts) and 56,700 strike (41,670 contracts). The maximum Call unwinding was seen at the 58,000 strike, which shed 59,160 contracts, followed by the 56,800 and 57,800 strikes, which shed 30,090 and 23,760 contracts, respectively.
Nifty Bank Put Option Data:
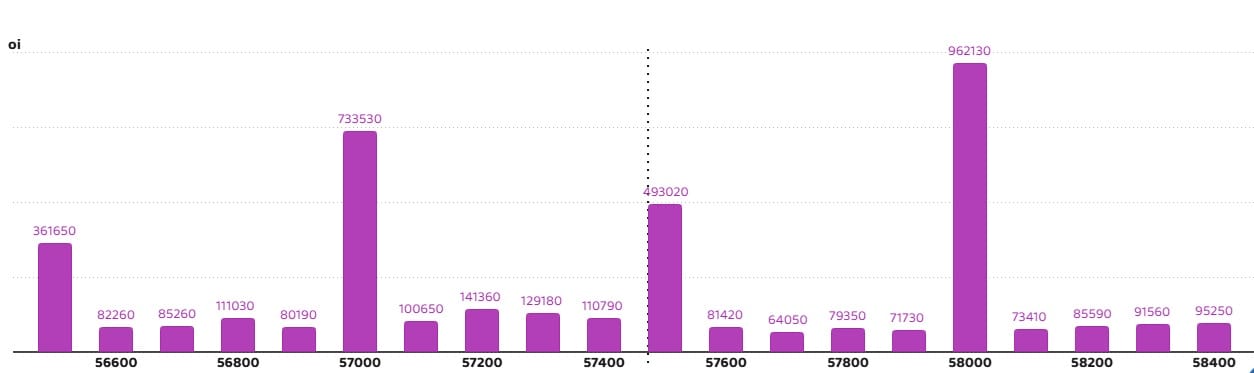
On the Put side, the maximum Put open interest was seen at the 58,000 strike (with 9.62 lakh contracts), which can act as a key level for the index in the short term. This was followed by the 57,000 strike (7.33 lakh contracts) and the 57,500 strike (4.93 lakh contracts).
The maximum Put writing was placed at the 57,500 strike (which added 2.07 lakh contracts), followed by the 57,200 strike (93,990 contracts) and 57,300 strike (76,140 contracts). The maximum Put unwinding was seen at the 58,000 strike, which shed 31,650 contracts, followed by the 56,800 and 58,200 strikes, which shed 15,540 and 13,170 contracts, respectively.
Written by Sunil Sankar Matkar
Source:Moneycontrol, Network18


No comments:
Post a Comment