

The three stocks are at different stages of their technical setups, but they share an important characteristic: buyers appear to be returning at key technical levels. For a lay investor, this matters because technical analysis is essentially the study of price behaviour. When price repeatedly holds important support or breaks through a resistance level, it provides clues about how market participants are positioning themselves.
The broader backdrop is supportive. ICRA expects India’s road logistics sector to record 8-10% revenue growth in FY2027, while organised players could benefit from their ability to command a premium in a competitive market. (ICRA) Logistics activity is also being supported by manufacturing, consumption, e-commerce and infrastructure development. (CBRE India)
TCI: Breakout Level turns into a Potential Demand Zone
The monthly chart of Transport Corporation of India (TCI) presents an interesting long-term structure. The stock had spent a considerable period below the Rs.858 level, before breaking decisively above it. This level is now being tested from the other side.
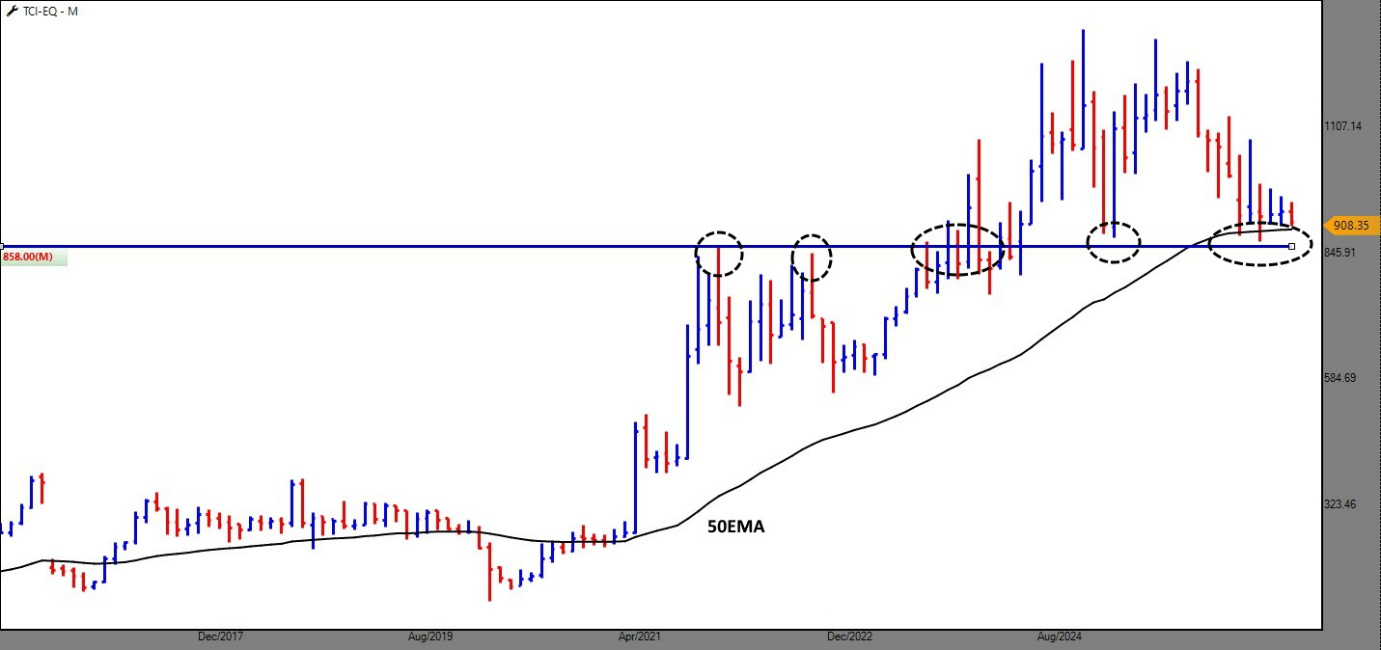
This is a classic technical principle: old resistance can become new support.
Interestingly, the 50-month exponential moving average, or 50MEMA, is rising steadily. A moving average simply smoothens price movements and helps investors identify the underlying trend. When the average itself is rising and price remains above it, the long-term trend is generally considered healthier.
The recent price action shows consolidation around the Rs.858-910 zone rather than a sharp rejection. That is constructive. If TCI sustains above 858 and subsequently moves above the recent consolidation zone, the stock could attempt to revisit its previous highs around the Rs.1,100-1,170 zone.
For investors, Rs.858 becomes the important technical line in the sand. Sustaining above it keeps the bullish structure intact; a decisive move back below it would weaken the setup.
RITCO: The Base and Reversal Pattern
Ritco's weekly chart arguably offers the most visually compelling setup. The stock has formed an inverse Head-and-Shoulders pattern, one of the better-known bullish reversal formations.
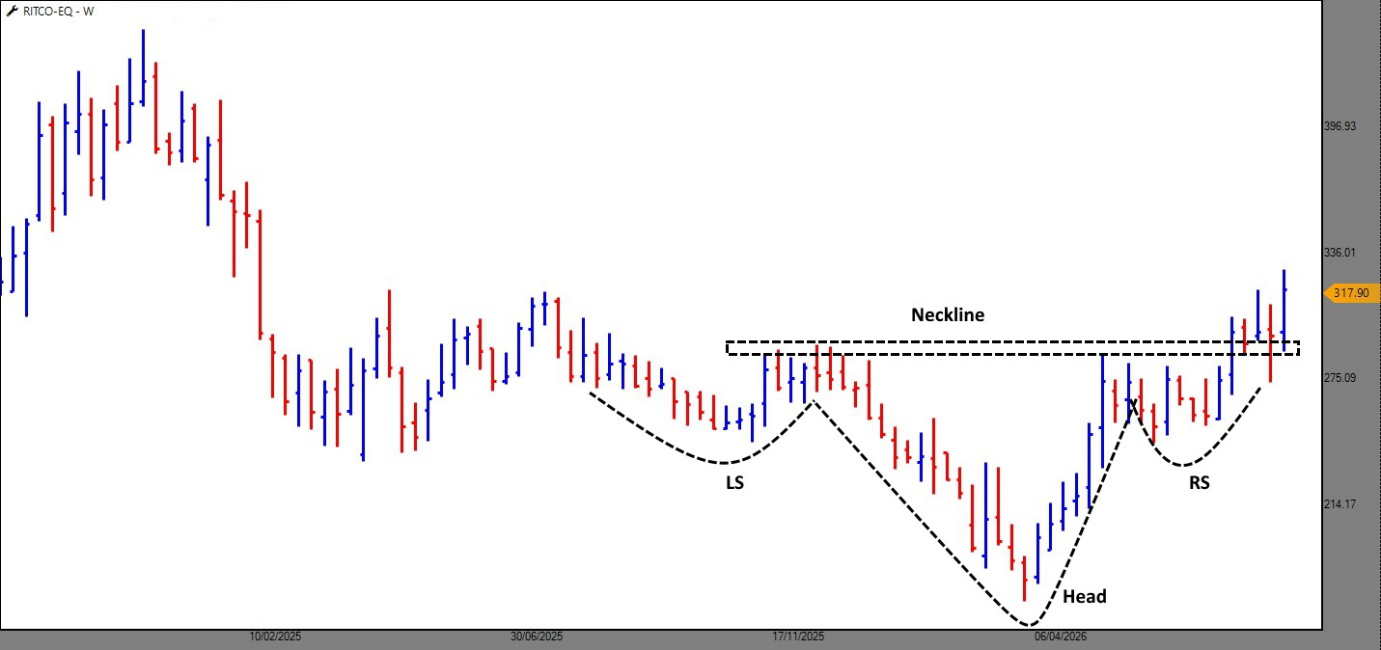
Think of the pattern as a market making three attempts to fall. The middle attempt – the “head” which goes deepest, while the two surrounding attempts – the “shoulders” are shallower. When the stock finally crosses the common resistance line, known as the neckline, it indicates that sellers have lost control.
RITCO has now moved above the neckline near the Rs.290 zone and is trading around Rs.318. This is important because the breakout is not merely an intraday move; it has occurred on the weekly chart, giving the signal greater significance.
The classical target for an inverse Head-and-Shoulders is calculated by measuring the distance between the head and neckline and adding it to the breakout point. On the chart, that points towards the potential zone of Rs.390-400, although technical targets are projections, not guarantees.
A healthy retest of the neckline followed by renewed buying would strengthen the bullish case.
Aegis Logistics: Waiting for the Follow-Through Breakout
Aegis Logistics presents a different picture. Its 3×3 Point & Figure chart shows a strong long-term upward structure, with price currently around Rs.1,397 and approaching the important Rs.1,481 resistance.
Point & Figure charts filter out much of the market noise and concentrate on meaningful price movements. The repeated X-columns indicate periods of demand, while O-columns represent supply.
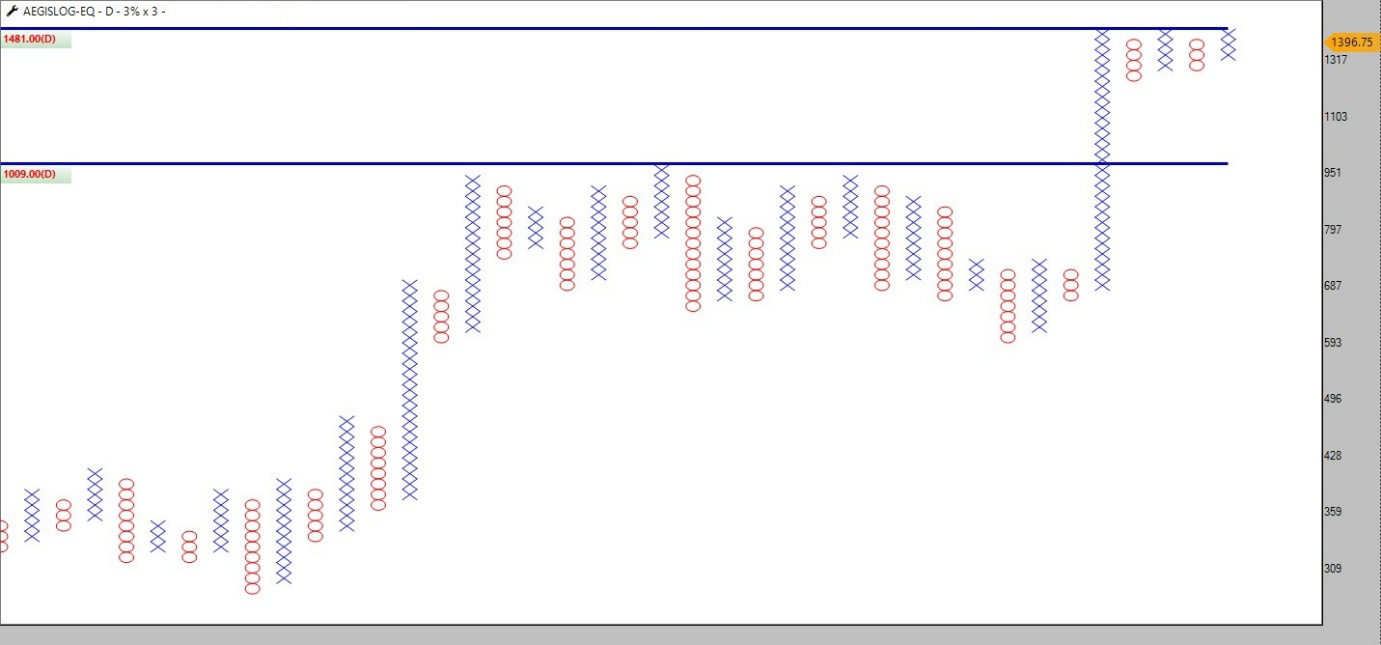
Aegis has already established a series of higher price zones, but the crucial technical event would be a decisive breakout above Rs.1,481. Such a move would take the stock into fresh territory on the chart and could signal renewed momentum.
Until that happens, investors should treat Rs.1,481 as the trigger rather than assuming the breakout in advance.
Are You Adding these 3 Logistics Stocks to Your Watchlist?
The three charts therefore offer three different stages of a potential bullish cycle. TCI is defending a major breakout zone, RITCO has already broken out of a classical reversal pattern, while Aegis is approaching a major resistance breakout.
The fundamental backdrop also provides support to the technical story. Indian Railways reported freight loading of 1,670 million tonnes in FY2026, up from 1,098 million tonnes in FY2014-15, highlighting the structural expansion of India’s freight ecosystem.
At present, the technical evidence across TCI, RITCO and Aegis Logistics points towards a probable bullish phase, but confirmation and disciplined risk management will determine whether that probability turns into a sustained trend.
Written by Mr Brijesh Bhatia
Source: FinancialExpress
Disclaimer:
Note: The purpose of this article is only to share interesting charts, data points and thought-provoking opinions. It is NOT a recommendation. If you wish to consider an investment, you are strongly advised to consult your advisor. This article is strictly for educative purposes only.


No comments:
Post a Comment