

Bears are showing no signs of relinquishing control, dragging the Nifty 50 down 1.2 percent despite a gap-up opening on September 15. Technical indicators remain firmly in favour of the bears, while market sentiment has been dampened by elevated US bond yields and crude oil prices, along with caution ahead of the FOMC meeting outcome. The Nifty 50 is expected to consolidate with a negative bias. A break below the crucial support level of 23,000 could strengthen bearish momentum and trigger panic selling. On the upside, the 23,400–23,500 zone is likely to act as a key hurdle, according to experts, who continue to recommend a sell-on-rallies strategy.
Levels for the Nifty50: (cmp23118.60):
Resistance based on pivot points: 23,458, 23,570, and 23,751
Support based on pivot points: 23,096, 22,984, and 22,802
The Nifty 50 formed a long bearish candle on the daily charts, continuing its lower high–lower low structure and reflecting the bears' control. All key moving averages continued to trend downward, while the index fell below the 61.8 percent Fibonacci retracement level of the rally from 22,183 to 24,774. The RSI slipped further to 22.23, its lowest level since March 2025, while the MACD extended its decline, with the red histogram bar expanding for the sixth consecutive session. All these indicators point to continued bearish momentum.
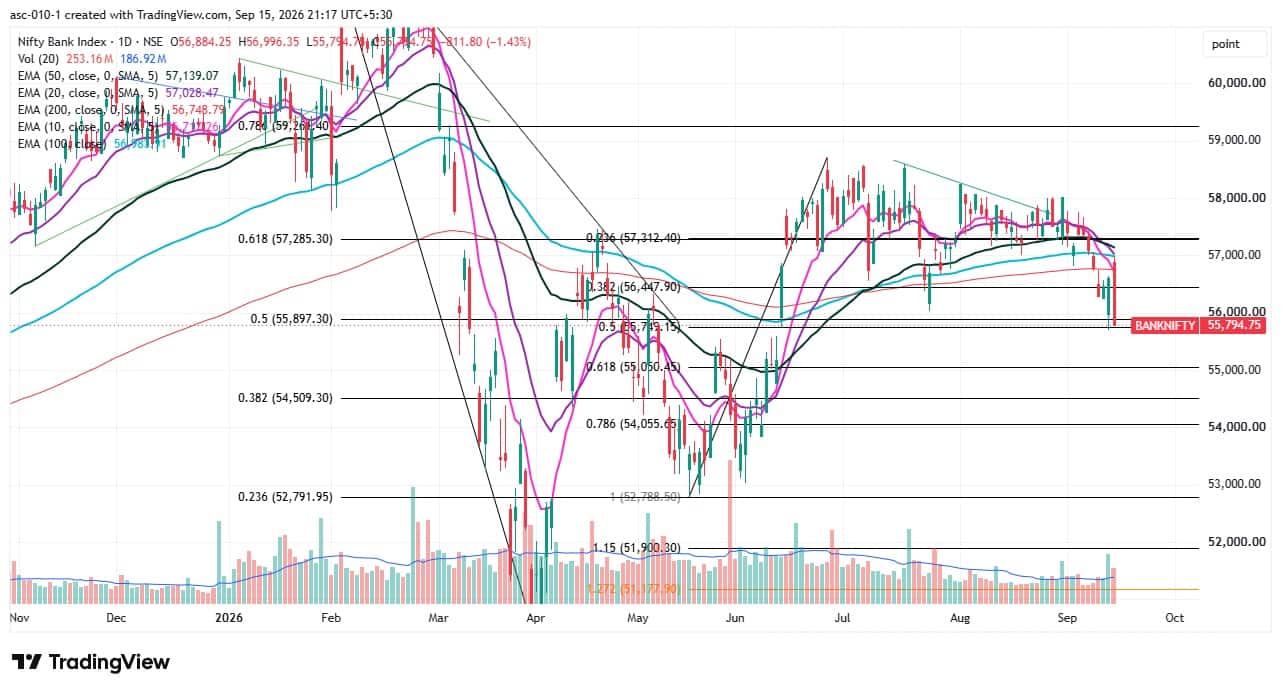
Levels For The BankNifty (55,795)
Resistance based on pivot points: 56,654, 56,938, and 57,397
Support based on pivot points: 55,736, 55,453, and 54,994
Resistance based on Fibonacci retracement: 57,285, 59,261
Support based on Fibonacci retracement: 55,749, 55,050
The Bank Nifty fell 1.43 percent and formed a sizeable red candle on the daily timeframe, signalling the strong presence of bears. The index traded below all key moving averages, with short- and medium-term moving averages trending downward. However, it managed to defend the 50 percent Fibonacci retracement level of the rally from the May low to the June high. The RSI slipped below the 40 level to 33.23, while the MACD maintained its downtrend below the zero line, with the red histogram bar deepening. All these indicators point to bearish phase.
Nifty Call Options Data:
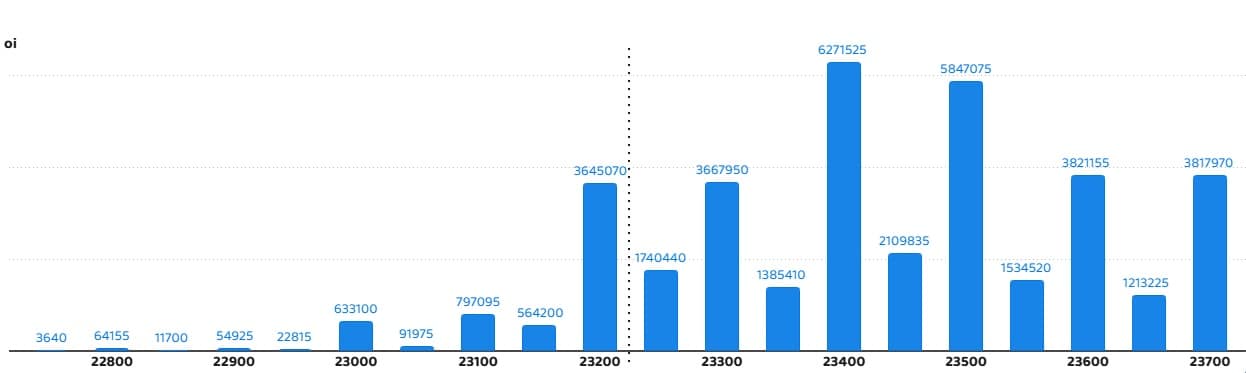
According to the weekly options data, the maximum Call open interest was seen at the 23,400 strike (with 62.71 lakh contracts). This level can act as a key resistance level for the Nifty in the short term. It was followed by the 23,500 strike (58.47 lakh contracts) and 23,600 strike (38.21 lakh contracts).
Maximum Call writing was observed at the 23,400 strike, which saw an addition of 42.02 lakh contracts, followed by the 23,200 and 23,500 strikes, which added 32.32 lakh and 30.7 lakh contracts, respectively. There was hardly any Call unwinding seen in the 22,750-23,700 strike band.
Nifty Put Options Data:
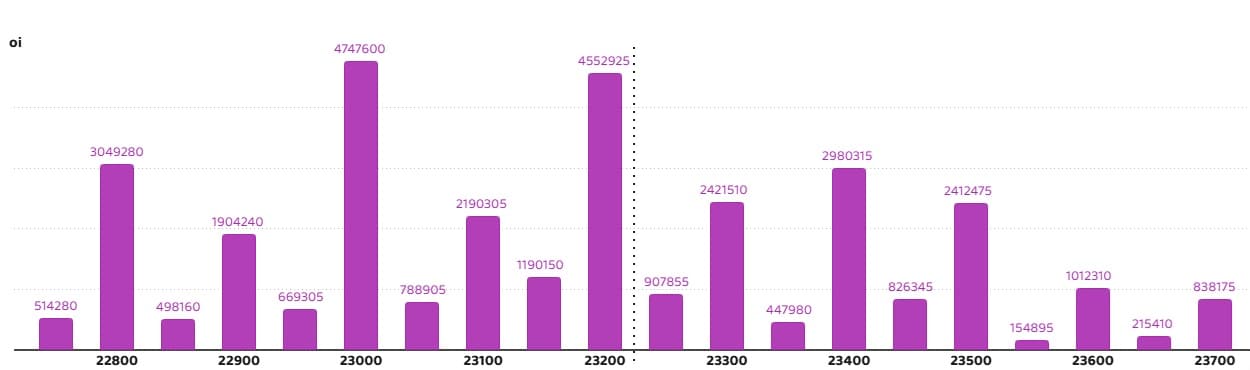
On the Put side, the 23,000 strike holds the maximum Put open interest (with 47.47 lakh contracts), which can act as a key support level for the Nifty in the short term. It was followed by the 23,200 strike (45.52 lakh contracts) and the 22,800 strike (30.49 lakh contracts).
The maximum Put writing was placed at the 23,200 strike, which saw an addition of 28.72 lakh contracts, followed by the 23,000 and 22,800 strikes, which added 19.15 lakh and 15.3 lakh contracts, respectively. There was hardly any Put unwinding seen in the 22,750-23,700 strike band.
Bank Nifty Call options data:
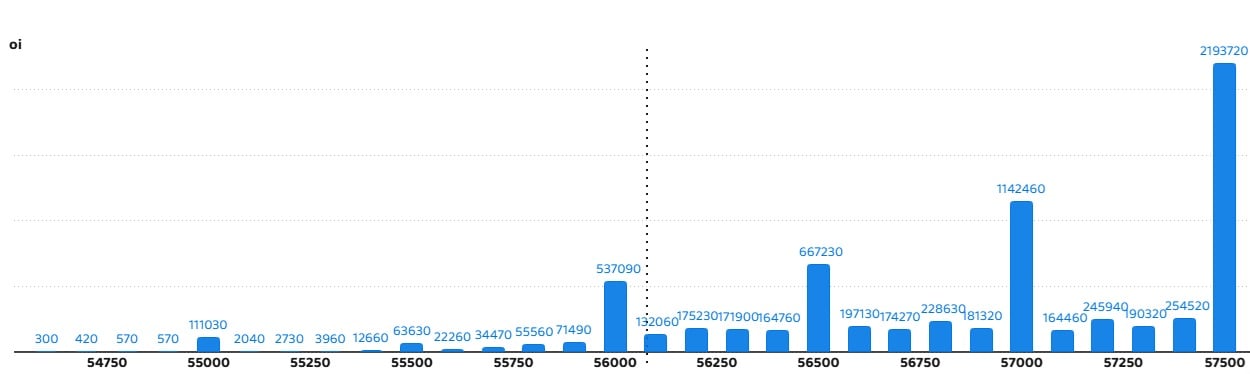
According to the monthly options data, the maximum Call open interest was seen at the 57,500 strike, with 21.93 lakh contracts. This can act as a key resistance level for the index in the short term. It was followed by the 57,000 strike (11.42 lakh contracts) and the 56,500 strike (6.67 lakh contracts).
Maximum Call writing was observed at the 57,000 strike (with the addition of 3.02 lakh contracts), followed by the 56,000 strike (2.74 lakh contracts) and 56,500 strike (2.68 lakh contracts). The maximum Call unwinding was seen at the 57,300 strike, which shed 13,380 contracts, followed by the 55,000 strike, which shed 1,080 contracts.
Bank Nifty put options data:
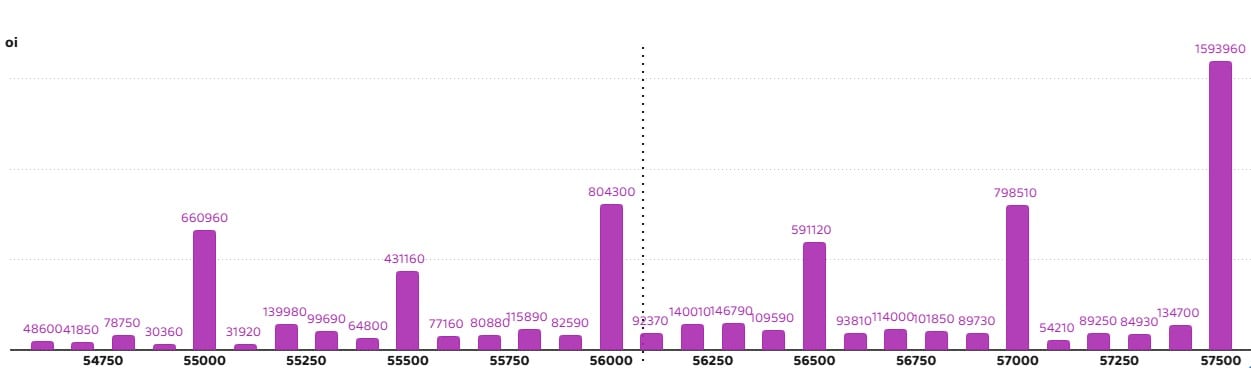
On the Put side, the 57,500 strike holds the maximum Put open interest (with 15.93 lakh contracts), which can act as a key level for the index in the short term. This was followed by the 56,000 strike (8.04 lakh contracts) and the 57,000 strike (7.98 lakh contracts).
The maximum Put writing was placed at the 55,000 strike (which added 15,180 contracts), followed by the 55,300 strike (12,510 contracts) and 55,600 strike (11,610 contracts). The maximum Put unwinding was seen at the 57,500 strike, which shed 77,790 contracts, followed by the 56,000 and 57,000 strikes which shed 63,960 and 62,790 contracts, respectively.
Report by Sunil Sankar Matkar
Source: Network18


No comments:
Post a Comment