


The Nifty 50 remained caught in a bear trap, falling more than 1.5 percent on September 28 and signalling caution ahead of the expiry of monthly derivative contracts on September 29. The sharp deterioration in the technical structure, along with US bond yields rising to a fresh 19-year high and the VIX spiking to a two-month high, added to the bearish sentiment. Following the significant sell-off, the index could see a rebound, although it is unlikely to sustain. If the Nifty 50 breaks below 22,700, the 22,500 level would be the next level to watch on the downside. However, a sustained move above 22,800 could drive the index towards 23,000, according to experts.
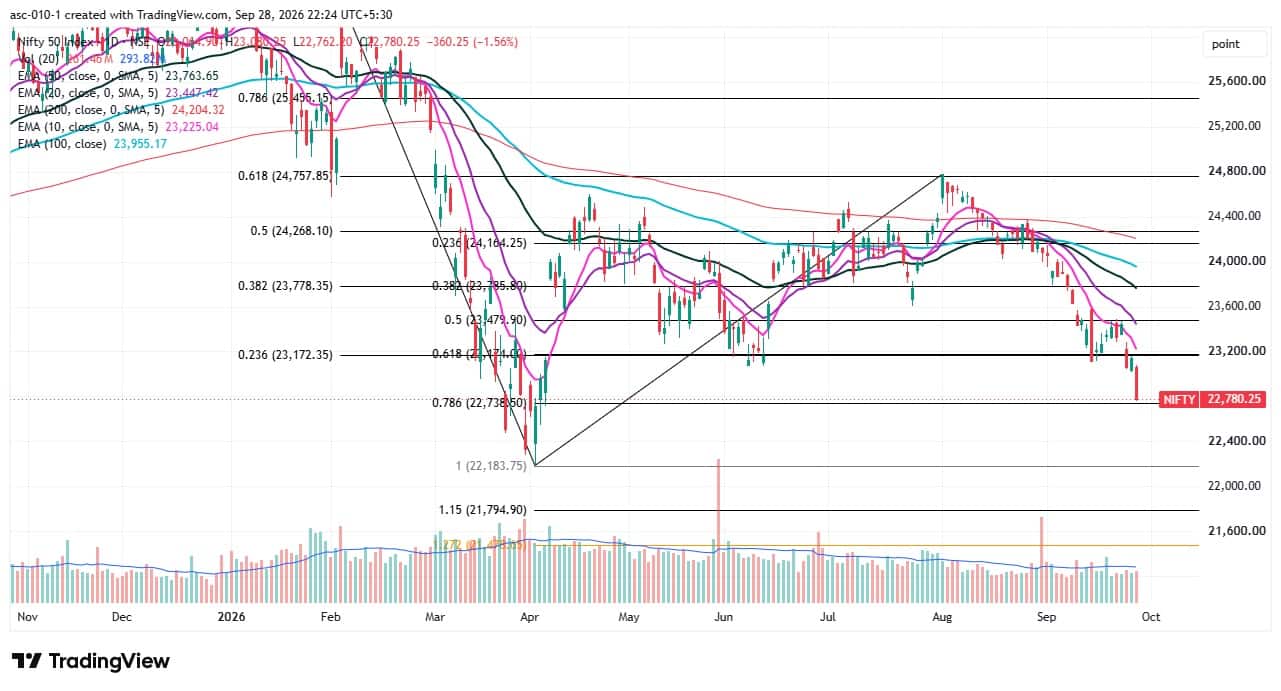 Here are 15 data points we have collated to help you spot profitable trades:1) Key Levels For The Nifty 50 (22,780)
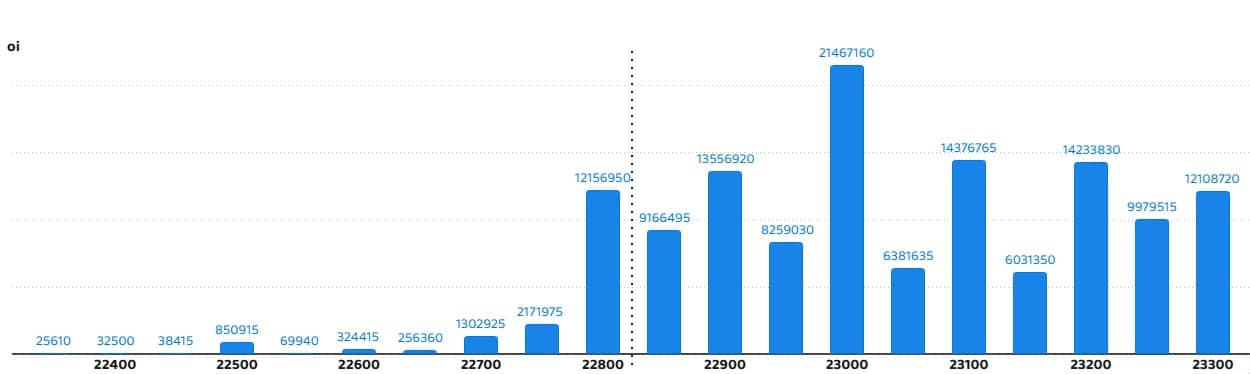
Resistance based on pivot points: 22,996, 23,071, and 23,192Support based on pivot points: 22,753, 22,678, and 22,556Special Formation: The Nifty 50 formed a long red candle on the daily chart, with a continuation of the lower high-lower low structure, indicating increasing bearish pressure. All key moving averages were sloping downward, while the RSI fell to 27.69, accompanied by a bearish crossover in the oversold zone. The MACD remained below the signal line, with a dark red bar on the histogram. All these indicators suggest that bearish momentum remains strong, with the index likely to remain under pressure in the near term.2) Key Levels For The Bank Nifty (54,472)Resistance based on pivot points: 55,130, 55,355, and 55,719Support based on pivot points: 54,403, 54,178, and 53,814Resistance based on Fibonacci retracement: 55,897, 57,285Support based on Fibonacci retracement: 54,333, 53,300Special Formation: The Bank Nifty also formed a long bearish candle on the daily timeframe, reflecting increasing selling pressure. The index remained below all key moving averages, with the short- and medium-term moving averages trending downward. The index moved closer to the 50 percent Fibonacci retracement level of the rally from the April low to the June high. The RSI fell to 30.24 and remained below its signal line. The MACD stayed below the reference line, while the red histogram bar expanded for the third consecutive day. All these indicators suggest that the index could remain under pressure in the near term.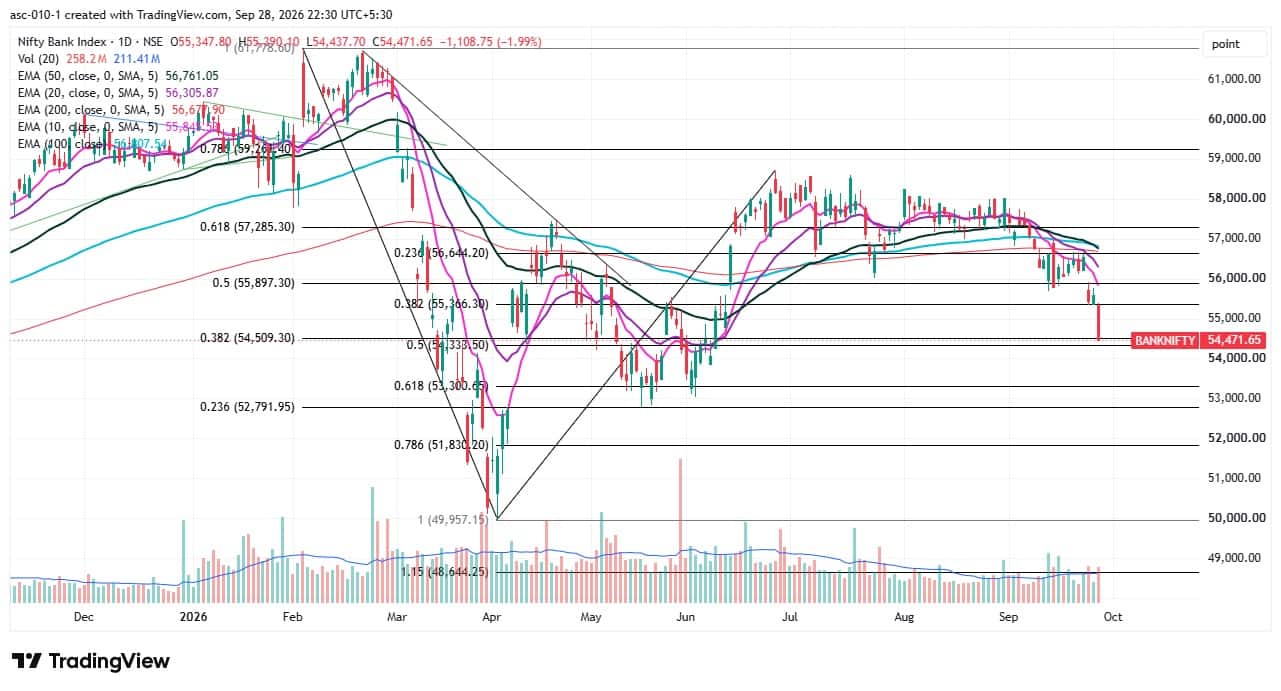 3) Nifty Call Options DataAccording to the monthly options data, the 23,000 strike holds the maximum Call open interest (with 2.14 crore contracts). This level can act as a key resistance level for the Nifty in the short term. It was followed by the 23,100 strike (1.43 crore contracts) and 23,200 strike (1.42 crore contracts).Maximum Call writing was observed at the 23,000 strike, which saw an addition of 1.81 crore contracts, followed by the 22,900 and 22,800 strikes, which added 1.31 crore and 1.17 crore contracts, respectively. There was hardly any Call unwinding seen in the 22,350-23,300 strike band.
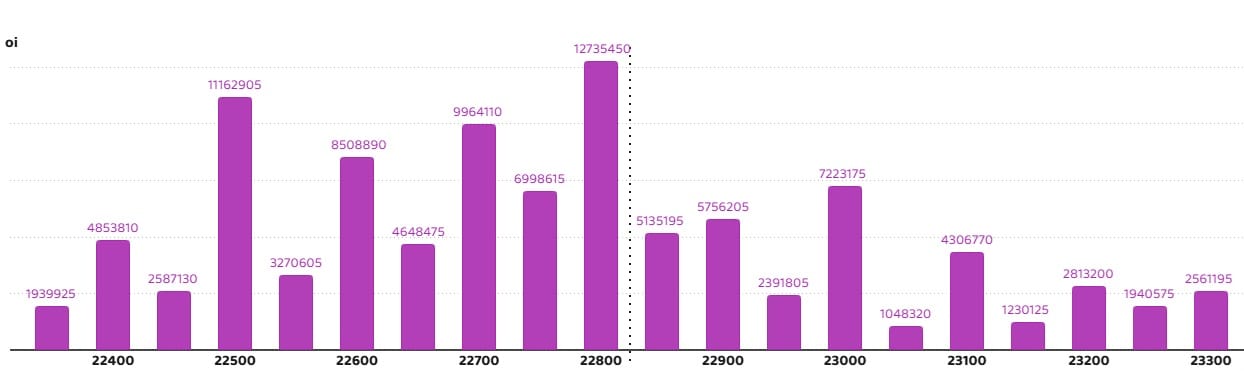
 4) Nifty Put Options DataOn the Put side, the maximum Put open interest was seen at the 22,800 strike (with 1.27 crore contracts), which can act as a key level for the Nifty in the short term. It was followed by the 22,500 strike (1.11 crore contracts) and the 22,700 strike (99.64 lakh contracts).The maximum Put writing was placed at the 22,800 strike, which saw an addition of 37.57 lakh contracts, followed by the 22,600 and 22,700 strikes, which added 36.1 lakh and 33.9 lakh contracts, respectively. The maximum Put unwinding was seen at the 23,000 strike, which shed 72.11 lakh contracts, followed by the 23,100 and 23,050 strikes, which shed 66.39 lakh and 52.89 lakh contracts, respectively.
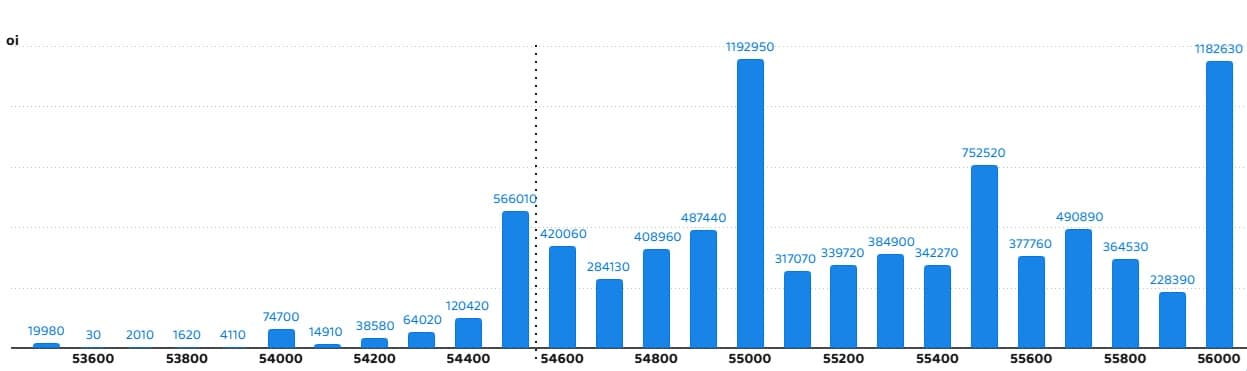
 5) Bank Nifty Call Options DataAccording to the monthly options data, the 55,000 strike holds the maximum Call open interest, with 11.92 lakh contracts. This can act as a key resistance level for the index in the short term. It was followed by the 56,000 strike (11.82 lakh contracts) and the 55,500 strike (7.52 lakh contracts).Maximum Call writing was observed at the 55,000 strike (with the addition of 10.78 lakh contracts), followed by the 54,500 strike (5.35 lakh contracts) and 54,800 strike (4.04 lakh contracts). There was hardly any Call unwinding seen in the 53,500-56,000 strike band.
 6) Bank Nifty Put Options DataOn the Put side, the maximum Put open interest was seen at the 54,000 strike (with 12.09 lakh contracts), which can act as a key support level for the index in the short term. This was followed by the 54,500 strike (7.44 lakh contracts) and the 53,500 strike (5.17 lakh contracts).The maximum Put writing was placed at the 54,000 strike (which added 3.3 lakh contracts), followed by the 54,500 strike (2.35 lakh contracts) and 54,200 strike (2.01 lakh contracts). The maximum Put unwinding was seen at the 55,500 strike, which shed 3.18 lakh contracts, followed by the 55,000 and 55,300 strikes which shed 2.62 lakh and 2.18 lakh contracts, respectively.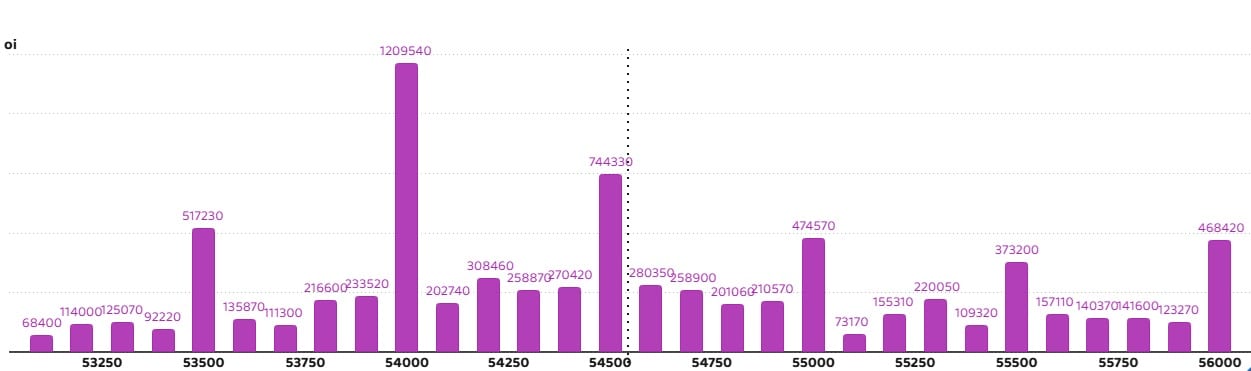
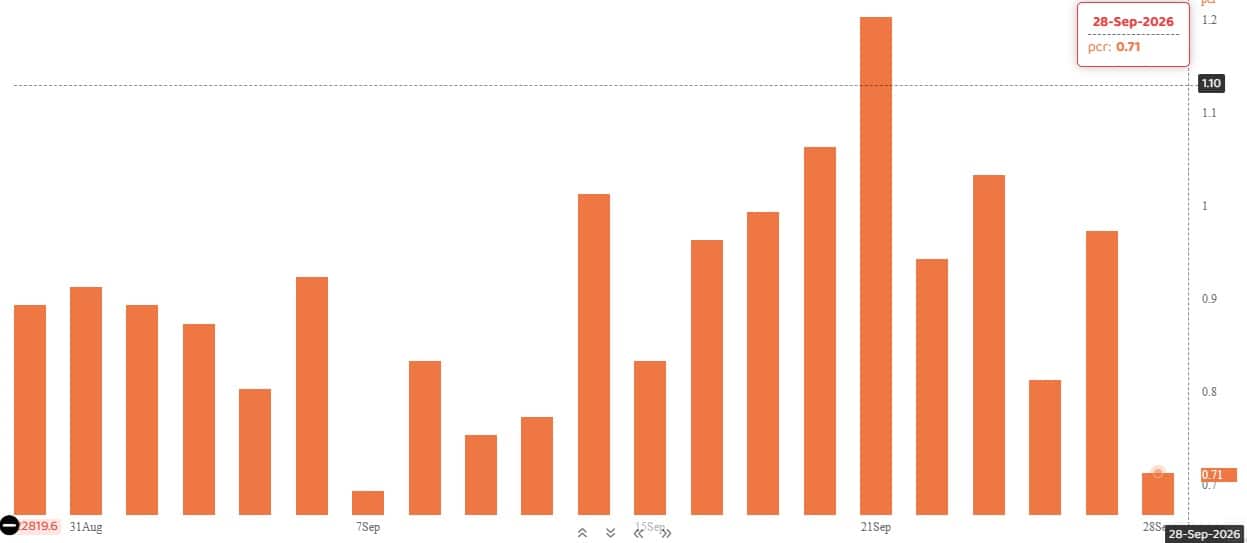
3) Nifty Call Options DataAccording to the monthly options data, the 23,000 strike holds the maximum Call open interest (with 2.14 crore contracts). This level can act as a key resistance level for the Nifty in the short term. It was followed by the 23,100 strike (1.43 crore contracts) and 23,200 strike (1.42 crore contracts).Maximum Call writing was observed at the 23,000 strike, which saw an addition of 1.81 crore contracts, followed by the 22,900 and 22,800 strikes, which added 1.31 crore and 1.17 crore contracts, respectively. There was hardly any Call unwinding seen in the 22,350-23,300 strike band.4) Nifty Put Options DataOn the Put side, the maximum Put open interest was seen at the 22,800 strike (with 1.27 crore contracts), which can act as a key level for the Nifty in the short term. It was followed by the 22,500 strike (1.11 crore contracts) and the 22,700 strike (99.64 lakh contracts).The maximum Put writing was placed at the 22,800 strike, which saw an addition of 37.57 lakh contracts, followed by the 22,600 and 22,700 strikes, which added 36.1 lakh and 33.9 lakh contracts, respectively. The maximum Put unwinding was seen at the 23,000 strike, which shed 72.11 lakh contracts, followed by the 23,100 and 23,050 strikes, which shed 66.39 lakh and 52.89 lakh contracts, respectively.5) Bank Nifty Call Options DataAccording to the monthly options data, the 55,000 strike holds the maximum Call open interest, with 11.92 lakh contracts. This can act as a key resistance level for the index in the short term. It was followed by the 56,000 strike (11.82 lakh contracts) and the 55,500 strike (7.52 lakh contracts).Maximum Call writing was observed at the 55,000 strike (with the addition of 10.78 lakh contracts), followed by the 54,500 strike (5.35 lakh contracts) and 54,800 strike (4.04 lakh contracts). There was hardly any Call unwinding seen in the 53,500-56,000 strike band.6) Bank Nifty Put Options DataOn the Put side, the maximum Put open interest was seen at the 54,000 strike (with 12.09 lakh contracts), which can act as a key support level for the index in the short term. This was followed by the 54,500 strike (7.44 lakh contracts) and the 53,500 strike (5.17 lakh contracts).The maximum Put writing was placed at the 54,000 strike (which added 3.3 lakh contracts), followed by the 54,500 strike (2.35 lakh contracts) and 54,200 strike (2.01 lakh contracts). The maximum Put unwinding was seen at the 55,500 strike, which shed 3.18 lakh contracts, followed by the 55,000 and 55,300 strikes which shed 2.62 lakh and 2.18 lakh contracts, respectively.7) Funds Flow (Rs crore)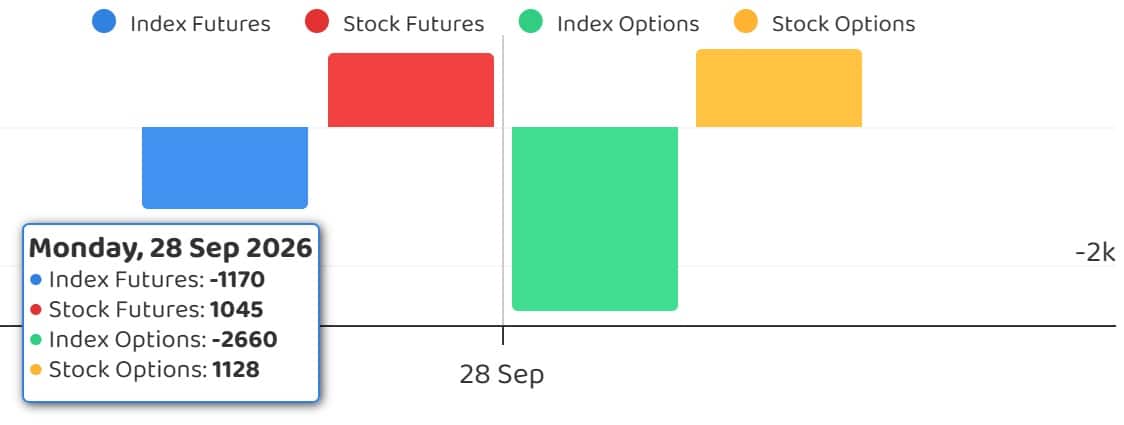 8) Put-Call RatioThe Nifty Put-Call ratio (PCR), which indicates the mood of the market, fell to 0.71 on September 28, compared to 0.97 in previous session.The increasing PCR, or being higher than 0.7 or surpassing 1, means traders are selling more Put options than Call options, which generally indicates the firming up of a bullish sentiment in the market. If the ratio falls below 0.7 or moves towards 0.5, then it indicates selling in Calls is higher than selling in Puts, reflecting a bearish mood in the market.
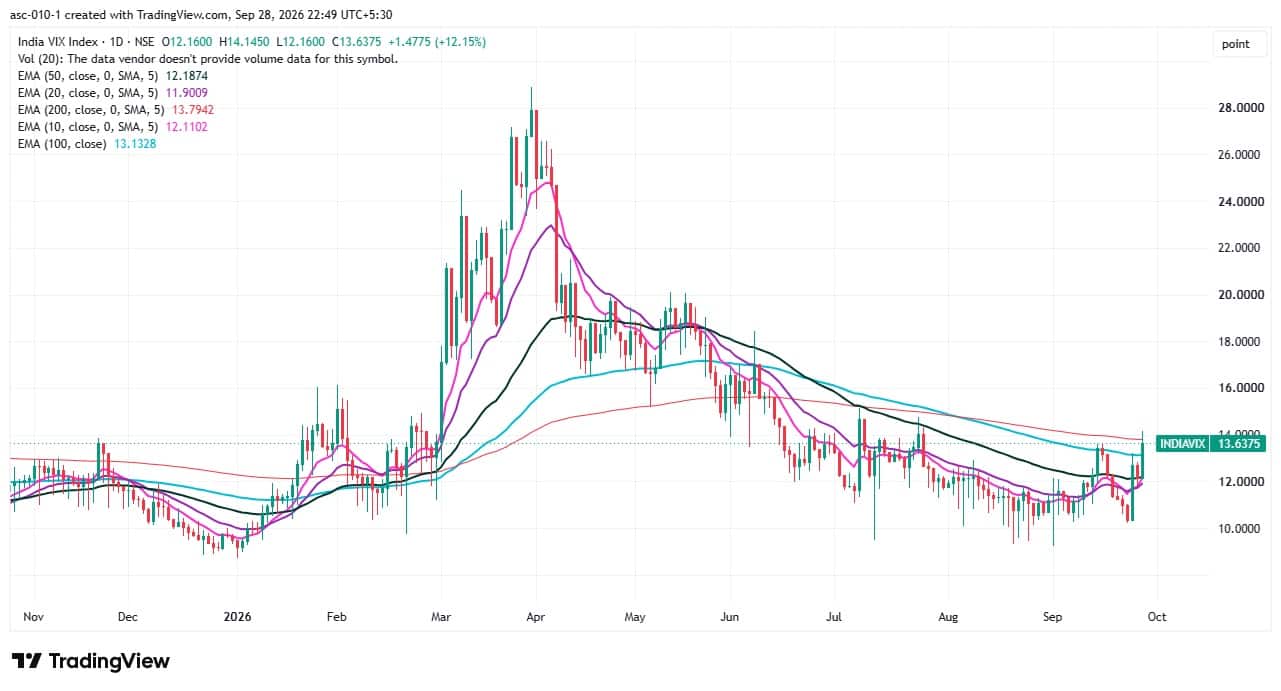
 9) India VIXIndia VIX, the market's fear gauge, jumped 12.15 percent to 13.63, its highest closing level since July 24, after declining in the previous session. The sharp rise signals increasing discomfort and caution among bulls. A sustained move above the 14 level could further increase downside risk for the market.
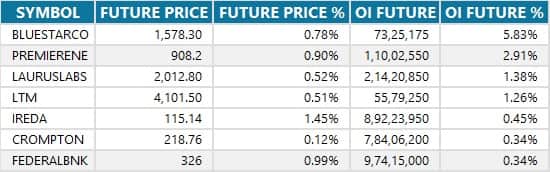
 10) Long Build-up (7 Stocks)A long build-up was seen in 7 stocks. An increase in open interest (OI) and price indicates a build-up of long positions.
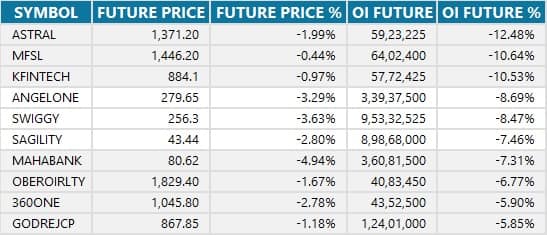
 11) Long Unwinding (110 Stocks)110 stocks saw a decline in open interest (OI) along with a fall in price, indicating long unwinding.
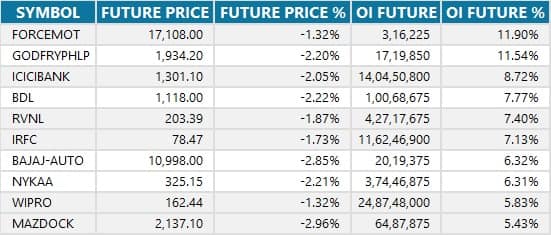
 12) Short Build-up (85 Stocks)85 stocks saw an increase in OI along with a fall in price, indicating a build-up of short positions.
 13) Short-Covering (11 Stocks)11 stocks saw short-covering, meaning a decrease in OI, along with a price increase.
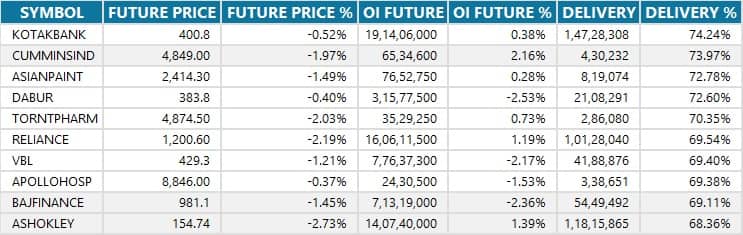
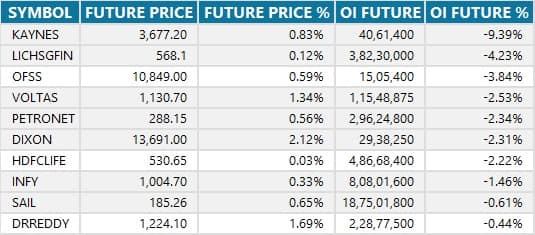 14) High Delivery TradesHere are the stocks that saw a high share of delivery trades. A high share of delivery reflects investing (as opposed to trading) interest in a stock.
 15) Stocks Under F&O BanSecurities banned under the F&O segment include companies where derivative contracts cross 95 percent of the market-wide position limit.Stocks added to F&O ban: NilStocks retained in F&O ban: LIC Housing Finance, SAILStocks removed from F&O ban: Kaynes Technology India, Manappuram Finance
8) Put-Call RatioThe Nifty Put-Call ratio (PCR), which indicates the mood of the market, fell to 0.71 on September 28, compared to 0.97 in previous session.The increasing PCR, or being higher than 0.7 or surpassing 1, means traders are selling more Put options than Call options, which generally indicates the firming up of a bullish sentiment in the market. If the ratio falls below 0.7 or moves towards 0.5, then it indicates selling in Calls is higher than selling in Puts, reflecting a bearish mood in the market.9) India VIXIndia VIX, the market's fear gauge, jumped 12.15 percent to 13.63, its highest closing level since July 24, after declining in the previous session. The sharp rise signals increasing discomfort and caution among bulls. A sustained move above the 14 level could further increase downside risk for the market.10) Long Build-up (7 Stocks)A long build-up was seen in 7 stocks. An increase in open interest (OI) and price indicates a build-up of long positions.11) Long Unwinding (110 Stocks)110 stocks saw a decline in open interest (OI) along with a fall in price, indicating long unwinding.12) Short Build-up (85 Stocks)85 stocks saw an increase in OI along with a fall in price, indicating a build-up of short positions.13) Short-Covering (11 Stocks)11 stocks saw short-covering, meaning a decrease in OI, along with a price increase.14) High Delivery TradesHere are the stocks that saw a high share of delivery trades. A high share of delivery reflects investing (as opposed to trading) interest in a stock.15) Stocks Under F&O BanSecurities banned under the F&O segment include companies where derivative contracts cross 95 percent of the market-wide position limit.Stocks added to F&O ban: NilStocks retained in F&O ban: LIC Housing Finance, SAILStocks removed from F&O ban: Kaynes Technology India, Manappuram FinanceSource: Network18
Disclaimer: The views and investment tips expressed by experts here are their own and not those of us. We advises traders to check with certified experts before taking any investment decisions.
Disclaimer: The views and investment tips expressed by experts here are their own and not those of us. We advises traders to check with certified experts before taking any investment decisions.


No comments:
Post a Comment