


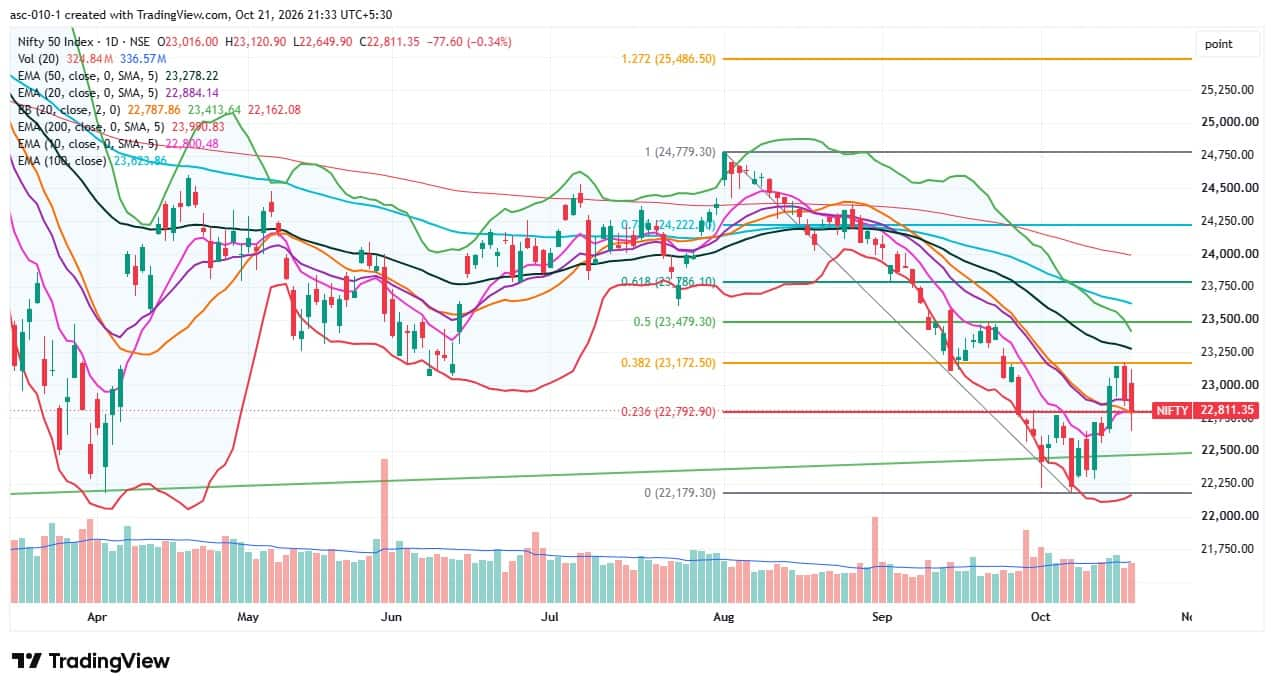
The Nifty 50 erased 1.33 percent from its intraday high of 23,120 to close 0.34 percent lower on October 21, extending its losses for a second consecutive session. The persistently weak broader market structure and elevated oil prices are likely to keep bearish sentiment intact. According to experts, if the index manages to hold above the Bollinger Bands' midline at 22,790 on a closing basis, a rebound toward the 22,900–23,000 zone is possible. The 23,200 level remains a crucial hurdle for any further sharp upside. However, a break below 22,790, followed by sustained trading below this level, could increase the likelihood of a further decline toward 22,600–22,500.
Resistance based on pivot points: 23,041, 23,152, and 23,332
Support based on pivot points: 22,681, 22,570, and 22,390Special Formation: The Nifty 50 formed a long bearish candle with sizeable upper and lower shadows on the daily chart, indicating persistent weakness amid volatility. After falling below the 20-day EMA, the index traded below all key moving averages, although it managed to hold marginally above the midline of the Bollinger Bands, which generally acts as a support level. The RSI declined to 46.27 but remained above its signal line. Meanwhile, the MACD maintained its uptrend above the reference line, although the green histogram bar contracted after expanding over the previous four sessions. Overall, these technical indicators suggest that bearish momentum is strengthening, while the index is attempting to hold near-term support, leaving room for a potential recovery if buying interest emerges.2) Key Levels For The NiftyBank(54,977)Resistance based on pivot points: 55,628, 55,904, and 56,351Support based on pivot points: 54,733, 54,457, and 54,009Resistance based on Fibonacci retracement: 55,657, 56,238Support based on Fibonacci retracement: 55,049, 54,053Special Formation: The Bank Nifty fell 0.92 percent and formed a long bearish candle on the daily chart, slipping decisively below its short-term moving averages and indicating rising selling pressure. The index is now trading below all key moving averages as well as the midline of the Bollinger Bands, signalling a weakening technical structure. The RSI declined to 43.51 and is nearing a bearish crossover. Meanwhile, the MACD moved lower but remained above its signal line, while the green histogram bar contracted for the second consecutive session. Overall, these technical indicators point to increasing bearish momentum.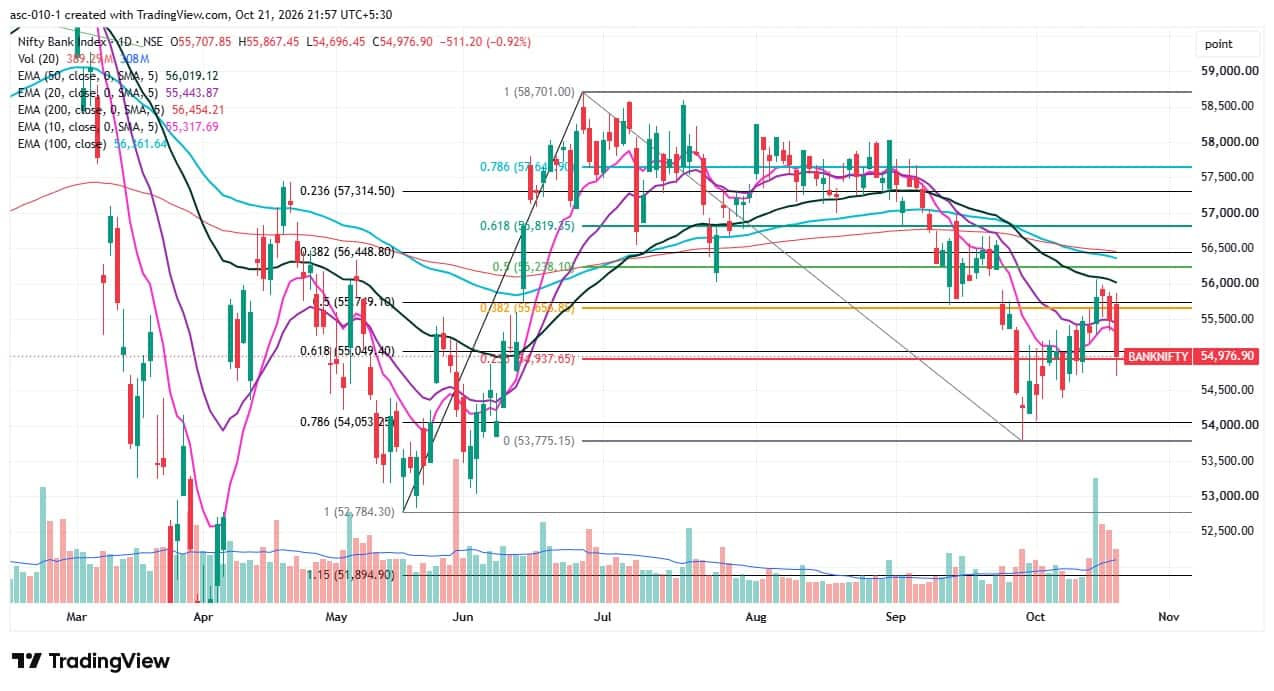 Report by Sunil Sankar Matkar
Network18


No comments:
Post a Comment