


The Nifty 50 remained firmly in the grip of bears on October 8, falling 1.64 percent and extending its southward journey for another session. Momentum indicators remained in bearish territory, while the index traded well below all key moving averages. Elevated oil prices, a weakening rupee, persistent FII outflows, and the India VIX moving above the 15 zone also weighed on market sentiment. If the Nifty 50 decisively breaks Thursday's low of 22,180, bears could target the psychological 22,000 mark, followed by 21,700, the April 2025 low. On the higher side, 22,400 may act as an immediate hurdle, followed by the 22,600-22,700 zone, according to experts.
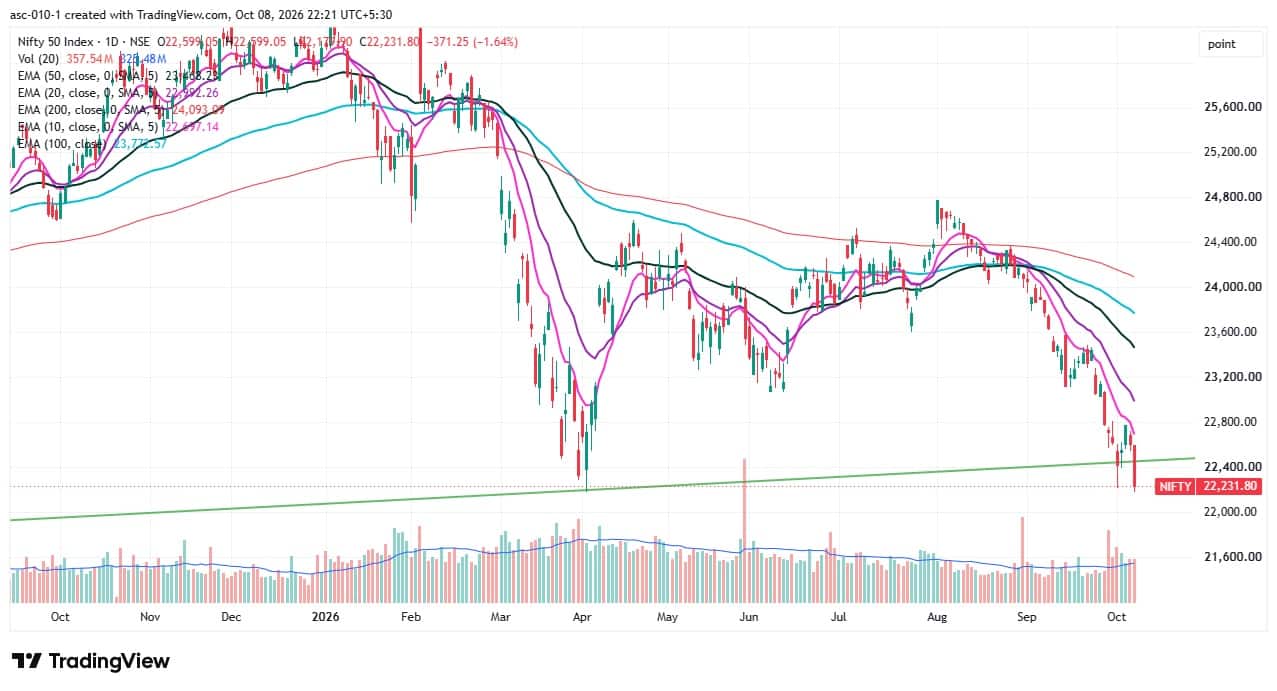
Here are Important data points we have collated to help you spot profitable trades:
1) Key Levels For The Nifty50 (22,232)
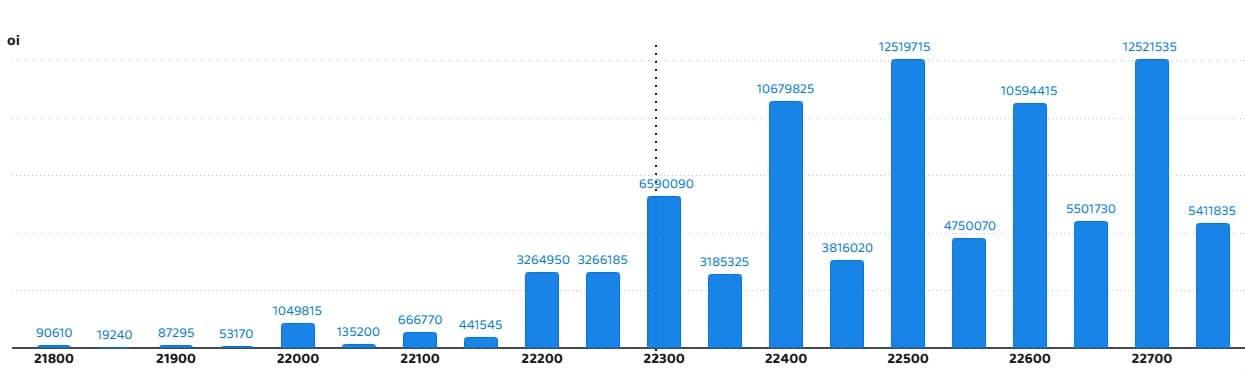
 3) Nifty 50 Call Options Data According to the weekly options data, the maximum Call open interest was seen at the 22,700 strike (with 1.252 crore contracts). This level can act as a key resistance level for the Nifty in the short term. It was followed by the 22,500 strike (1.251 crore contracts) and 22,400 strike (1.06 crore contracts).Maximum Call writing was observed at the 22,500 strike, which saw an addition of 1 crore contracts, followed by the 22,400 and 22,300 strikes, which added 98.66 lakh and 63.07 lakh contracts, respectively. There was hardly any Call unwinding seen in the 21,800-22,750 strike band.
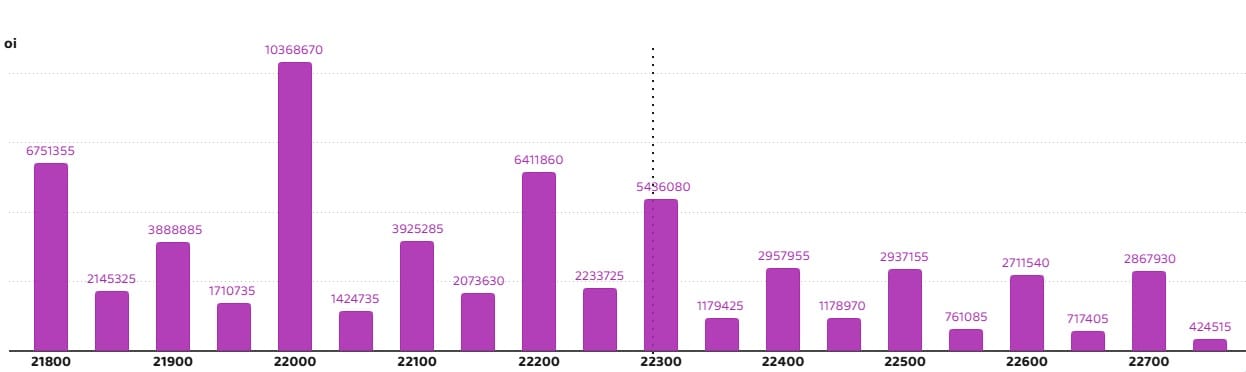
 4) Nifty50 Put Options Data:On the Put side, the 22,000 strike holds the maximum Put open interest (with 1.03 crore contracts), which can act as a key support level for the Nifty in the short term. It was followed by the 21,800 strike (67.51 lakh contracts) and the 22,200 strike (64.11 lakh contracts).The maximum Put writing was placed at the 22,000 strike, which saw an addition of 32.72 lakh contracts, followed by the 21,800 and 22,300 strikes, which added 26.07 lakh and 14.82 lakh contracts, respectively. The maximum Put unwinding was seen at the 22,600 strike, which shed 35.39 lakh contracts, followed by the 22,500 and 22,550 strikes, which shed 19.92 lakh and 13.03 lakh contracts, respectively.
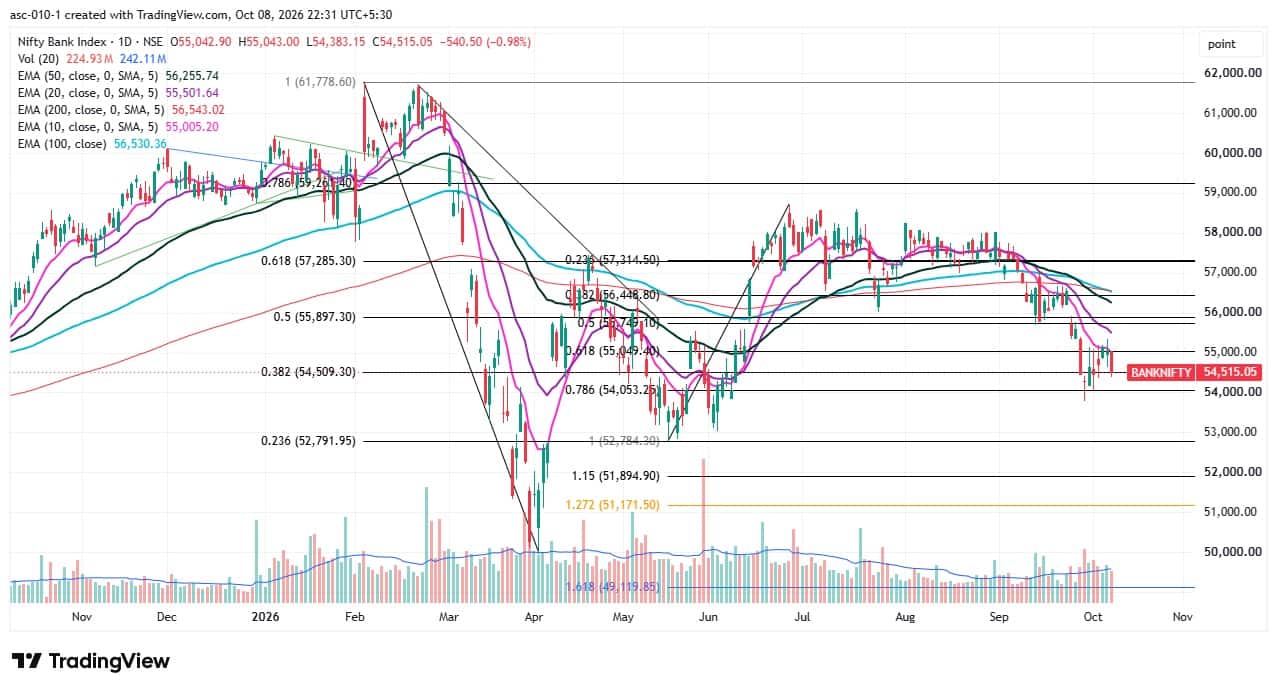
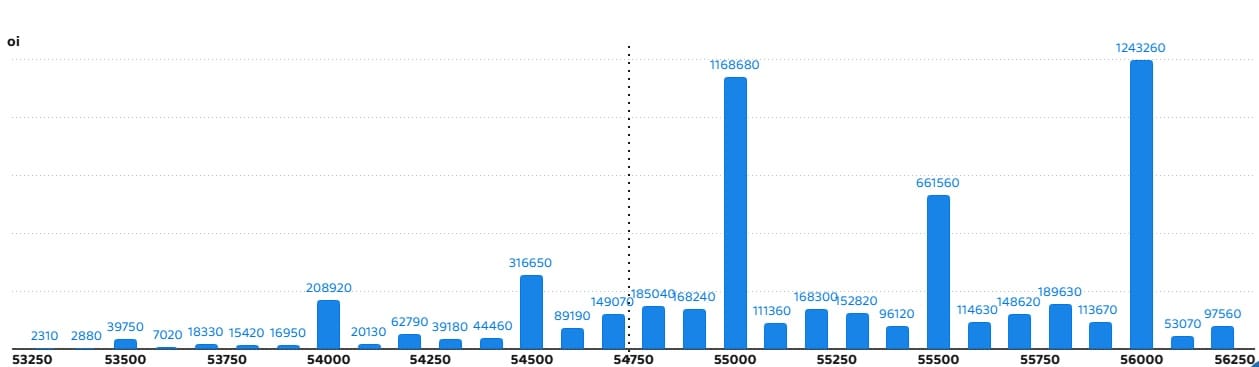
 5) Nifty Bank Call Options DataAccording to the monthly options data, the maximum Call open interest was seen at the 56,000 strike, with 12.43 lakh contracts. This can act as a key resistance level for the index in the short term. It was followed by the 55,000 strike (11.68 lakh contracts) and the 55,500 strike (6.61 lakh contracts).Maximum Call writing was observed at the 55,000 strike (with the addition of 3.2 lakh contracts), followed by the 56,000 strike (87,870 contracts) and 54,700 strike (86,580 contracts). The maximum Call unwinding was seen at the 55,100 strike, which shed 31,680 contracts, followed by the 55,200 and 55,300 strikes, which shed 17,610 and 7,800 contracts, respectively.
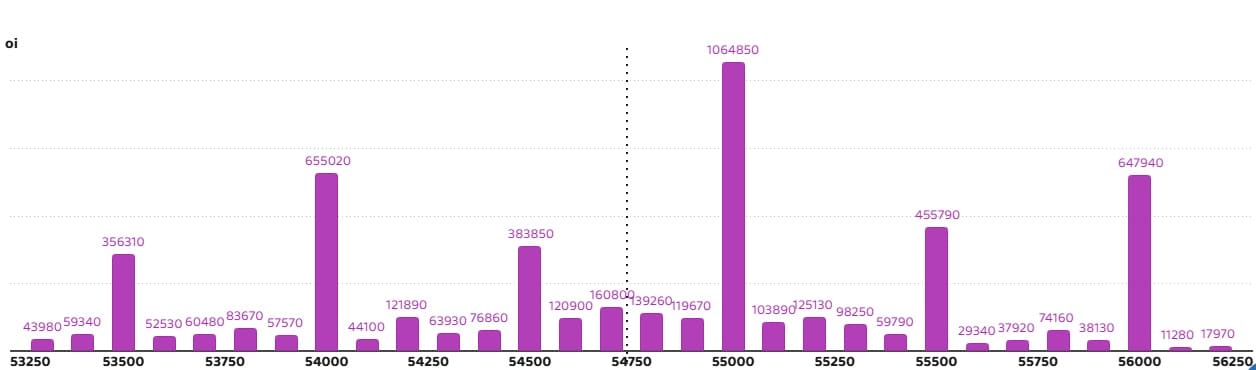
 6) Nifty Bank Put Options Data:On the Put side, the 55,000 strike holds the maximum Put open interest (with 10.64 lakh contracts), which can act as a key level for the index in the short term. This was followed by the 54,000 strike (6.55 lakh contracts) and the 56,000 strike (6.47 lakh contracts).The maximum Put writing was placed at the 54,600 strike (which added 28,710 contracts), followed by the 53,400 strike (17,640 contracts) and 53,300 strike (15,780 contracts). The maximum Put unwinding was seen at the 54,500 strike, which shed 88,710 contracts, followed by the 55,200 and 55,300 strikes, which shed 88,050 and 58,320 contracts, respectively.
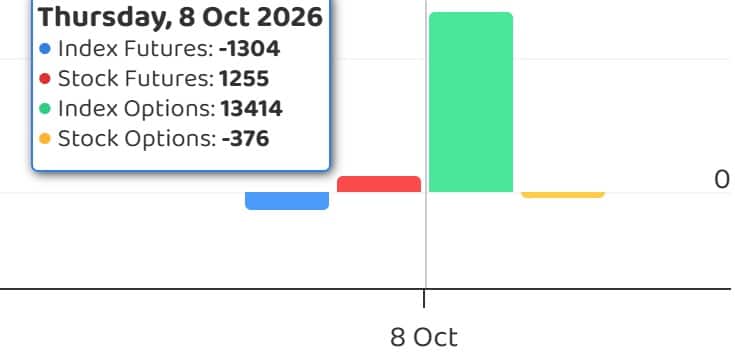
 7) Funds Flow (Rs in Crores)
  8) Put-Call Ratio:The Nifty Put-Call ratio (PCR), which indicates the mood of the market, dropped to 0.73 on October 8, compared to 0.89 in previous session.The increasing PCR, or being higher than 0.7 or surpassing 1, means traders are selling more Put options than Call options, which generally indicates the firming up of a bullish sentiment in the market. If the ratio falls below 0.7 or moves towards 0.5, then it indicates selling in Calls is higher than selling in Puts, reflecting a bearish mood in the market.


No comments:
Post a Comment