
The Nifty 50 rebounded after a day of profit booking, closing 0.58 percent higher amid choppy trading on November 16 and marking a positive start to the week. Consolidation continued for another session, but the overall trend remains bullish, with all key moving averages sloping upward and the RSI sustaining in the bullish zone. The index continues to face resistance in the 25,300–25,400 zone. A convincing breakout above this range could pave the way for a move towards 25,500, followed by the crucial resistance zone of 25,900–26,000. Until then, the index is likely to remain in consolidation, with support seen at 25,100–25,000, according to market experts.
Here are few data points we have collated to help you spot profitable trades:
1) Key LevelsResistance based on pivot points: 25,330, 25,369, and 25,432
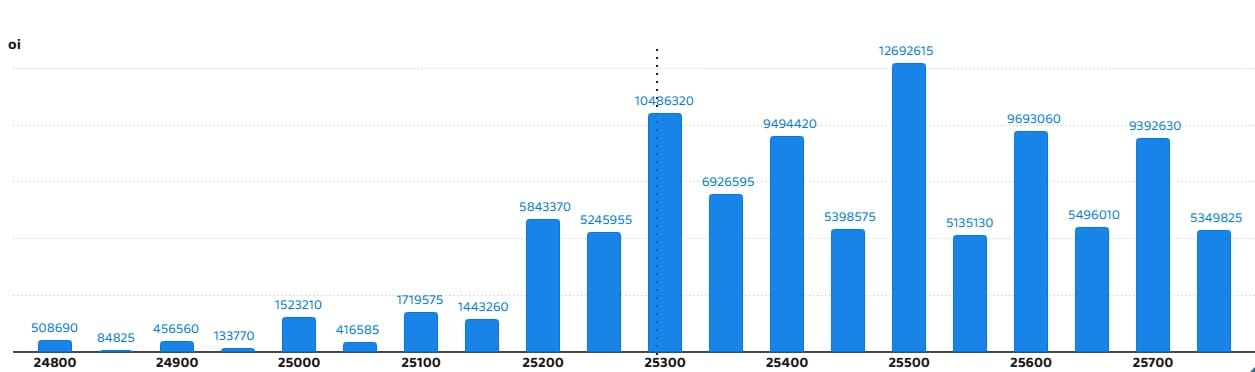
Support based on pivot points: 25,204, 25,165, and 25,101Special Formation: The Nifty 50 formed a small bullish candle with a minor upper shadow on the daily charts, signalling a lacklustre trading session at higher levels. The index continues to trade above all key moving averages, all of which are trending upward. The 50-day EMA is on the verge of crossing above the 100-day EMA, indicating a strengthening trend. The RSI at 76.59 remains in the bullish zone. The MACD continues to trend upward, although the green histogram bars have contracted for the fifth consecutive session. Taken together, these technical indicators suggest that the broader trend remains positive, but momentum may be showing signs of moderation.2) Key Levels For The Bank Nifty (61,576)Resistance based on pivot points: 61,691, 61,809, and 62,000Support based on pivot points: 61,310, 61,192, and 61,001Resistance based on Fibonacci retracement: 61,765, 63,550Support based on Fibonacci retracement: 59,798, 58,616Special Formation: The Bank Nifty rose 0.89 percent, moving closer to its record high and outperforming the Nifty 50. The banking index formed a bullish candle with a minor upper shadow on the daily timeframe, indicating a positive bias despite some profit booking at higher levels. All key moving averages continued to trend upward, with the golden crossover remaining intact. The RSI at 77.32 sustained in the bullish zone. The MACD maintained its upward trajectory, although the green histogram bar contracted for another consecutive session. These technical indicators suggest that the broader trend remains firmly bullish, although the fading MACD histogram points to possible moderation in momentum at higher levels.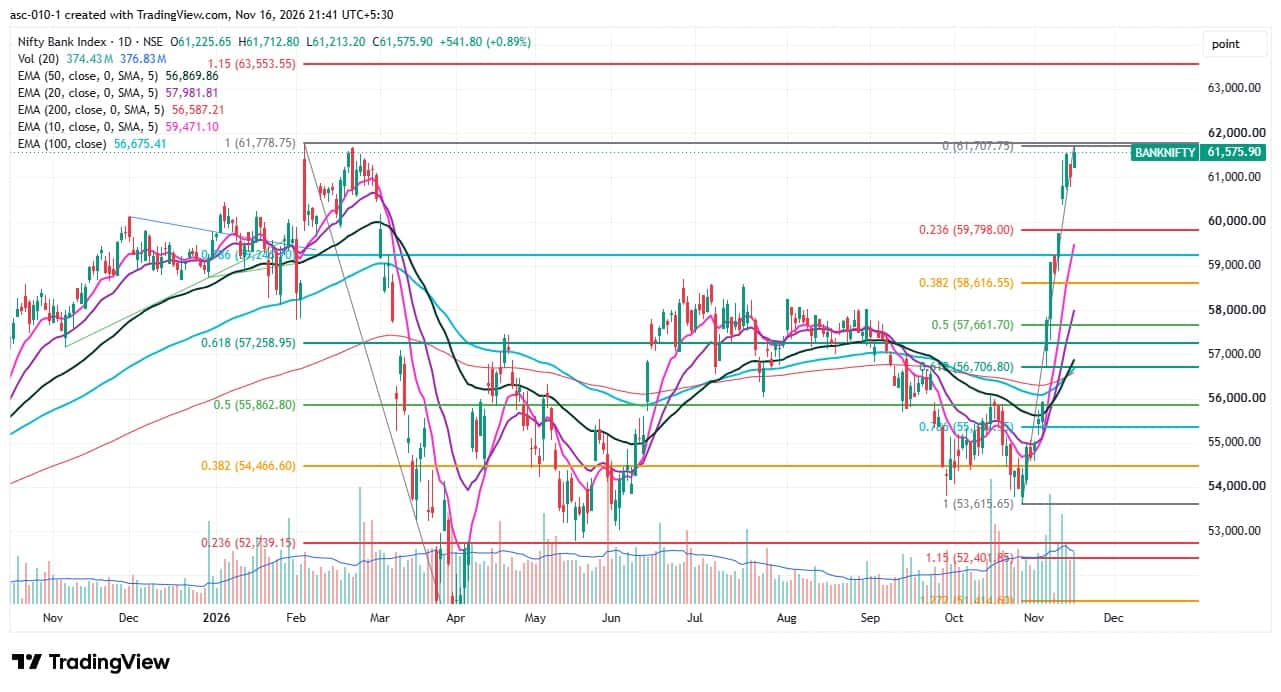 3) Nifty Call Options DataAccording to the weekly options data, the maximum Call open interest was seen at the 25,500 strike (with 1.26 crore contracts). This level can act as a key resistance level for the Nifty in the short term. It was followed by the 25,300 strike (1.04 crore contracts) and 25,600 strike (96.93 lakh contracts).Maximum Call writing was observed at the 25,600 strike, which saw an addition of 43.44 lakh contracts, followed by the 25,650 and 25,300 strikes, which added 32.91 lakh and 29.64 lakh contracts, respectively. The maximum Call unwinding was seen at the 25,100 strike, which shed 25.8 lakh contracts, followed by the 25,200 and 25,150 strikes, which shed 23.09 lakh and 18.85 lakh contracts, respectively.
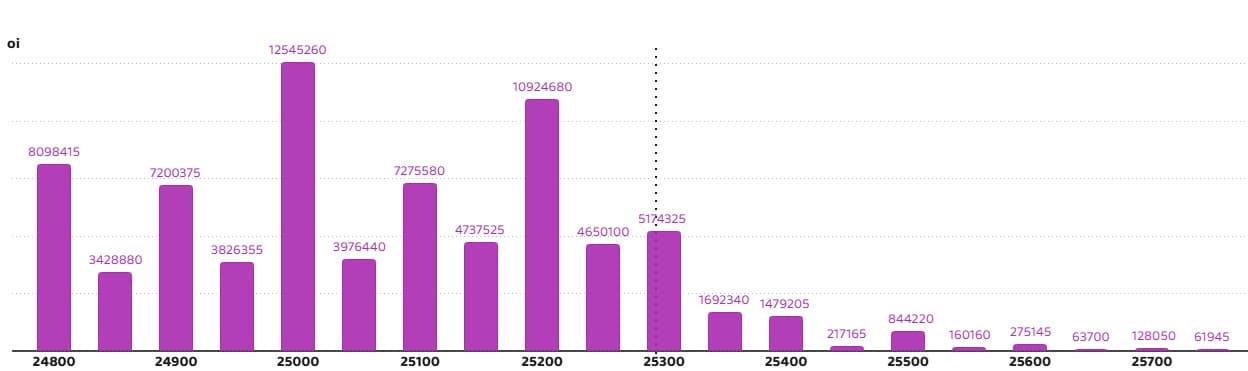
 4) Nifty Put Options DataOn the Put side, the 25,000 strike holds the maximum Put open interest (with 1.25 crore contracts), which can act as a key support level for the Nifty in the short term. It was followed by the 25,200 strike (1.09 crore contracts) and the 24,800 strike (80.98 lakh contracts).The maximum Put writing was placed at the 25,200 strike, which saw an addition of 61.83 lakh contracts, followed by the 25,000 and 25,250 strikes, which added 48.42 lakh and 35.98 lakh contracts, respectively. The maximum Put unwinding was seen at the 25,500 strike, which shed 6.61 lakh contracts, followed by the 25,700 and 25,650 strikes, which shed 54,925 and 12,675 contracts, respectively.
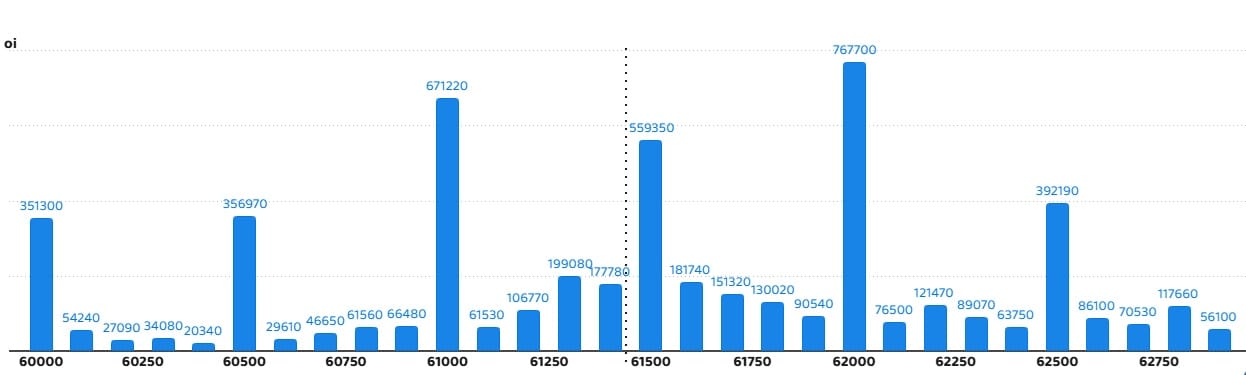
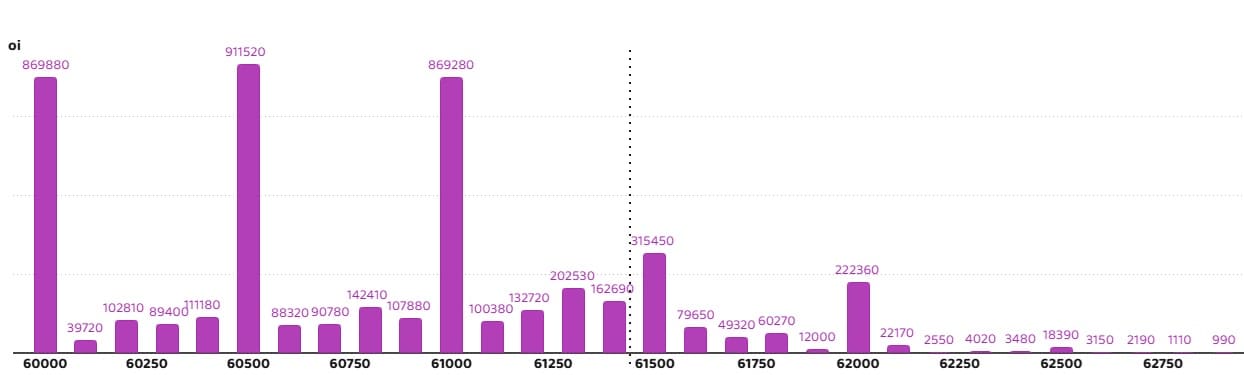
 5) Bank Nifty Call Options DataAccording to the monthly options data, the maximum Call open interest was seen at the 62,000 strike, with 7.67 lakh contracts. This can act as a key resistance level for the index in the short term. It was followed by the 61,000 strike (6.71 lakh contracts) and the 61,500 strike (5.59 lakh contracts).Maximum Call writing was observed at the 61,600 strike (with the addition of 93,870 contracts), followed by the 61,500 strike (67,980 contracts) and 61,700 strike (65,460 contracts). The maximum Call unwinding was seen at the 60,500 strike, which shed 4.21 lakh contracts, followed by the 61,000 and 61,100 strikes, which shed 1.96 lakh and 77,790 contracts, respectively.
 6) Bank Nifty Put Options DataOn the Put side, the 60,500 strike holds the maximum Put open interest (with 9.11 lakh contracts), which can act as a key support level for the index in the short term. This was followed by the 60,000 strike (8.698 lakh contracts) and the 61,000 strike (8.692 lakh contracts).The maximum Put writing was placed at the 61,500 strike (which added 1.35 lakh contracts), followed by the 61,400 strike (1.16 lakh contracts) and 61,300 strike (1.14 lakh contracts). The maximum Put unwinding was seen at the 60,500 strike, which shed 3.25 lakh contracts, followed by the 60,900 and 60,800 strikes, which shed 29,430 and 23,340 contracts, respectively.
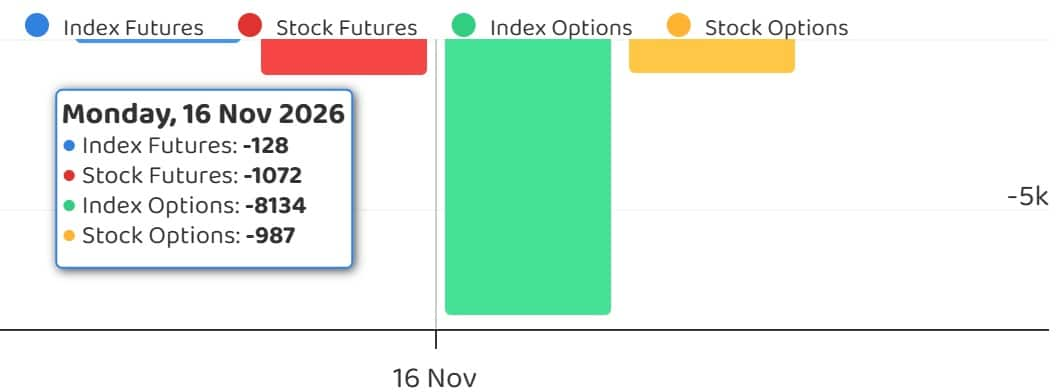
 7) Funds Flow (Rs crore)
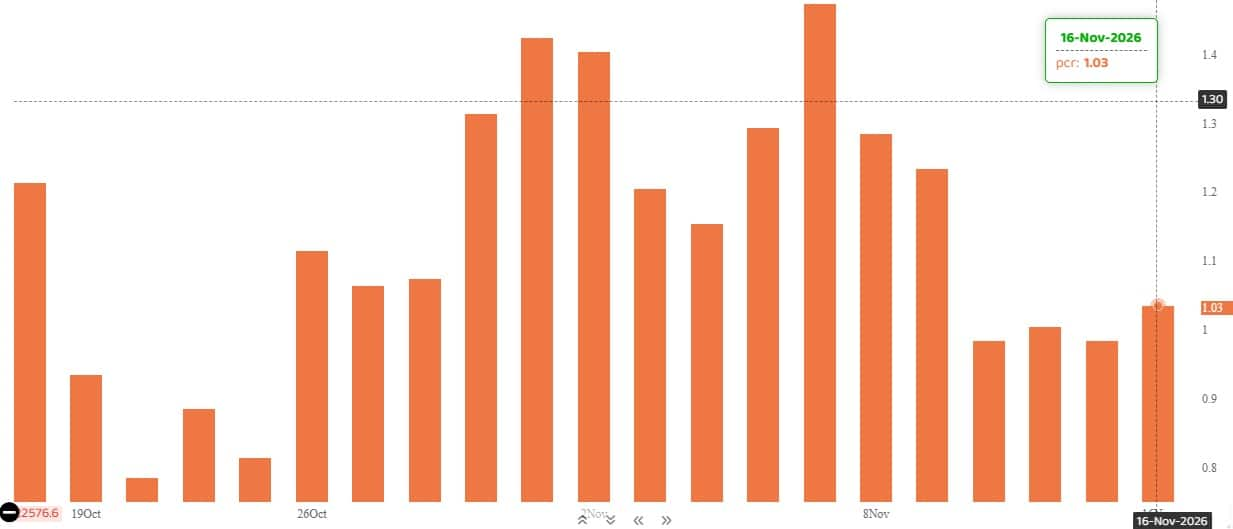
 8) Put-Call RatioThe Nifty Put-Call ratio (PCR), which indicates the mood of the market, rose to 1.03 on November 16, compared to 0.98 in previous session.The increasing PCR, or being higher than 0.7 or surpassing 1, means traders are selling more Put options than Call options, which generally indicates the firming up of a bullish sentiment in the market. If the ratio falls below 0.7 or moves towards 0.5, then it indicates selling in Calls is higher than selling in Puts, reflecting a bearish mood in the market.
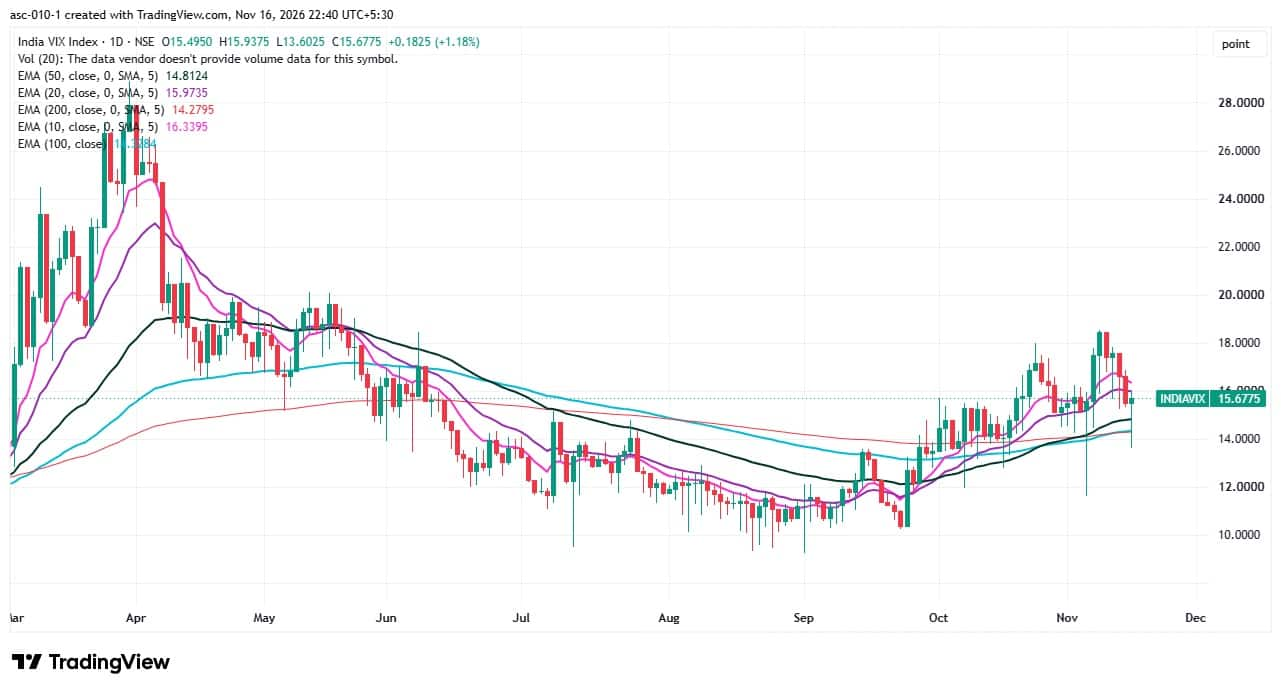
 9) India VIXThe volatility gauge, India VIX, climbed 1.18 percent to 15.68 on Monday and continued to trade above its medium- and long-term moving averages. A decline below the 14 mark would be necessary for bulls to move into a more comfortable zone. Overall, the market volatility remains relatively elevated, warranting some caution among investors despite the prevailing bullish trend.
 Report by Sunil Sankar Matkar


No comments:
Post a Comment