SENSEX
- Max call OI: 79,000
- Max put OI: 75,000
- (Expiry: 21 Jan)
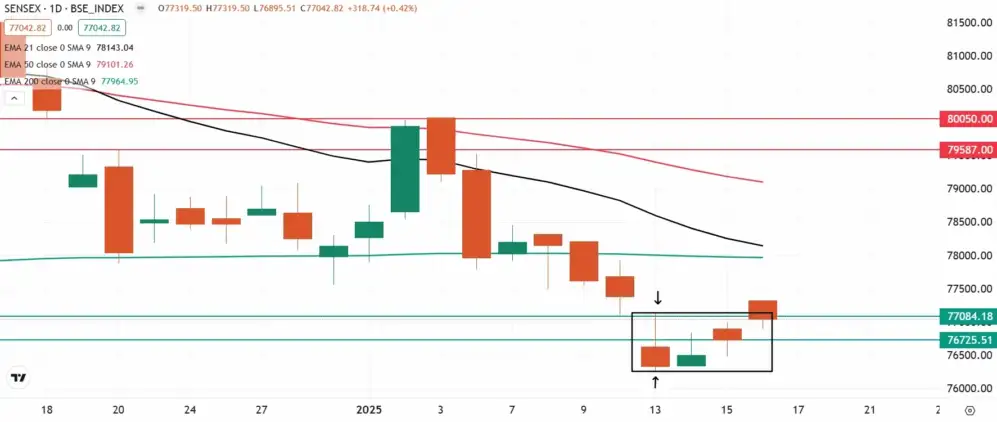
The SENSEX extended its rebound for the third consecutive day, closing Thursday's session in positive territory. However, the index fell short of confirming the inverted hammer candlestick pattern formed on January 13, as it faced rejection at the high point of the reversal pattern.
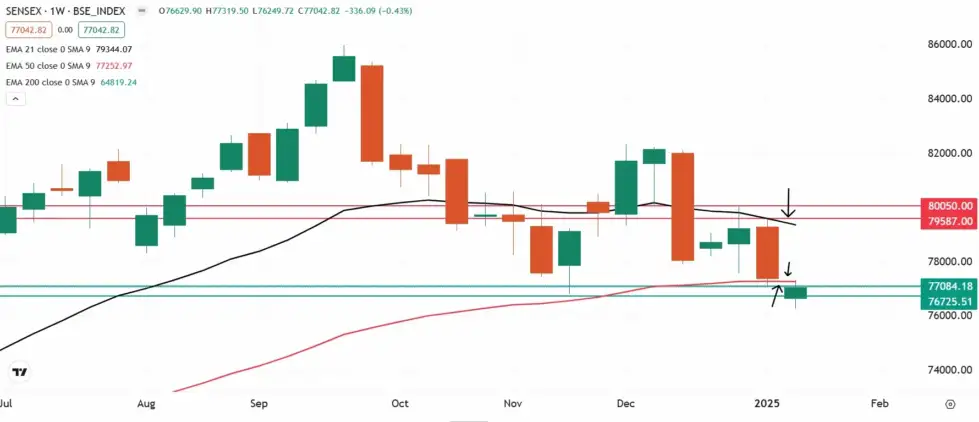
The technical outlook for the SENSEX, based on the weekly chart, remains bearish as the index continues to trade below the weekly 20 EMA. While it managed to hold the weekly 50 EMA on a closing basis last week, it has stayed below this support level throughout the week.
Traders should closely watch this critical support, as a decisive close below it would indicate further weakness. Conversely, if the index successfully defends this level and reclaims the weekly 50 EMA, it could potentially extend its rebound toward the weekly 20 EMA.

On the daily chart, traders can monitor the high and low of the inverted hammer candlestick pattern formed on 13 January. As highlighted on the chart below, a breakout of these levels will provide further short-term directional clues.

*** *** *** *** ***
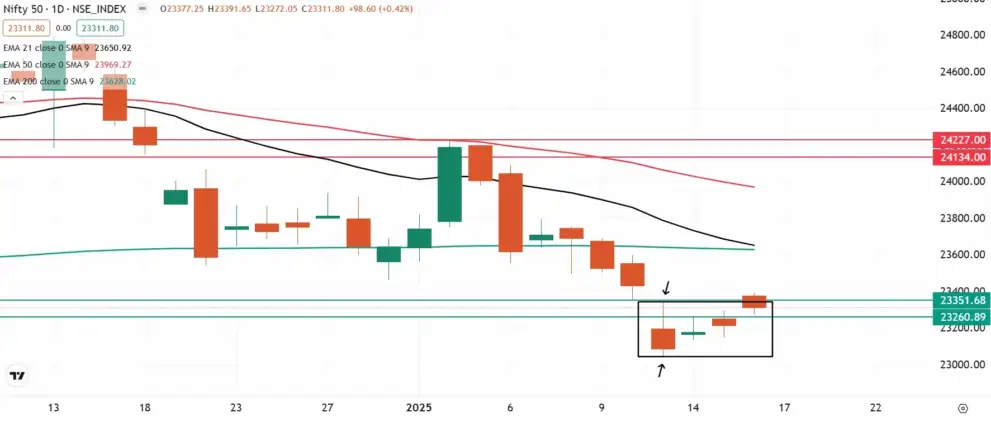
The Nifty 50 extended its upward move and formed higher lows for three consecutive days, closing 0.4 percent higher on January 16. The index managed to close above the November low (23,263) and surpassed the 23,350 hurdle intraday. However, the overall sentiment remained in favour of the bears, as the index continued to trade well below all key moving averages. Therefore, the index is expected to consolidate, with immediate support at 23,150, followed by 23,050 (January low). In the event of a continuation of the uptrend, the key hurdle is at 23,500, as above this level, the 200-day EMA at 23,680 will be the level to watch.
Today, 17/1/25, Gift Nifty is hinting at a muted start for Nifty 50 index today. At 7:30 AM, Gift Nifty was seen trading at 23,334. Overnight, Dow Jones, Nasdaq and S&P500 closed in the red
Levels For The NIFTY50(23,312)
Resistance based on pivot points: 23,371, 23,399, and 23,445
Support based on pivot points: 23,280, 23,251, and 23,206
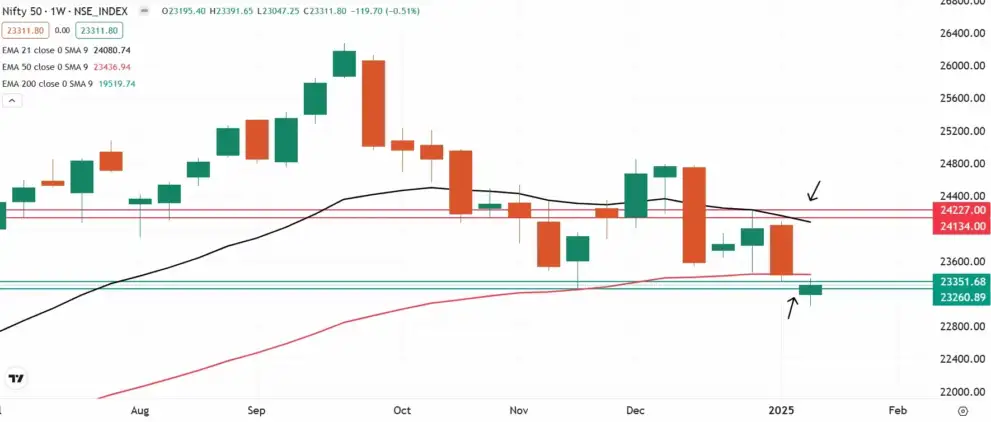
The Nifty 50 formed a bearish candlestick pattern on the daily charts with above-average volumes, continuing the formation of higher highs for another session. However, the momentum indicators remain in negative territory, and the index is sustaining below all key moving averages, signaling an overall bearish phase for the market. Additionally, on the weekly charts, the index formed a bullish candlestick pattern with minor upper and long lower shadows, indicating buying interest at lower levels. Despite this, the index remains below the 50-week EMA and is trading near the lower end of the Bollinger Bands.
Meanwhile, the technical structure as per the weekly chart remains bearish with index trading below its weekly 21 and 50 exponential moving averages. This indicates that the broader trend of the index remains weak and the index may face resistance on rebounds. However, traders can closely monitor the weekly close. A close above 50 weekly EMA will extend the rally up to weekly 21 EMA. On the flip side, a rejection from 50 EMA will indicate weakness.

On the daily chart, traders can monitor the high and low of the inverted hammer candlestick pattern formed on 13 January. A breakout from these levels on a closing basis will provide short-term directional clues.

*** *** *** *** ***
Levels For The NIFTY BANK (49,279)
Resistance based on pivot points: 49,419, 49,519, and 49,679
Support based on pivot points: 49,098, 48,999, and 48,838
Resistance based on Fibonacci retracement: 49,445, 50,410
Support based on Fibonacci retracement: 47,864, 46,078
The Nifty Bank maintained higher tops and higher bottoms for the third consecutive session, particularly since hitting a seven-month low on December 13. It formed a bullish candlestick pattern on the daily charts but remains in the lower band of the Bollinger Bands and below all key moving averages. The momentum indicator RSI (Relative Strength Index) at 39 showed a positive crossover but is still in the lower band, and the MACD (Moving Average Convergence Divergence) remains below the zero line, signaling a negative bias. On the weekly timeframe, the index formed a long bullish candlestick pattern but is still below the 50-week EMA of 49,930.
👉Stocks to watch today include Infosys, Reliance Industries, Axis Bank, LTIM, DB Corp, Havells and more. Earlier on Thursday, Sensex climbed 318.74 points or 0.42 per cent to close at 77,042.82. The Nifty 50 index rallied 98.60 points or 0.42 per cent to settle at 23,311.80.
FII-DII activity
Foreign Institutional Investors (FIIs) persisted with their selling streak for the 10th consecutive session, offloading shares worth ₹4,341 crore. Meanwhile, Domestic Institutional Investors (DIIs) sustained their buying trend, purchasing shares worth ₹2,928 crore


No comments:
Post a Comment