

The Nifty 50 staged a healthy performance on June 16 after a couple of days of correction, rising nearly 1 percent to move closer to the 25,000 zone. The uptrend in global markets, despite ongoing geopolitical tensions, supported the rally. This upward move pushed the index above its short-term moving averages and the midline of the Bollinger Bands, signaling a positive bias. Experts note that as long as the index sustains above 24,800, an upward move toward the 25,000–25,200 zone is possible in the upcoming sessions. However, if it falls below 24,800, support is placed at 24,700, followed by 24,500.
Levels for Nifty50: cmp24946.50
Resistance based on pivot points: 24,973, 25,035, and 25,136
Support based on pivot points: 24,772, 24,710, and 24,609
The Nifty 50 formed a long bullish candlestick pattern on the daily charts for a second consecutive session, negating the lower tops and bottoms formation of the previous two sessions. It traded above short-term moving averages (10- and 20-day EMAs) and the midline of the Bollinger Bands. The Relative Strength Index (RSI) stood at 55.70, tilting upward, indicating a likely positive crossover.
Levels For The Nifty Bank :cmp55,945
Resistance based on pivot points: 56,012, 56,158, and 56,394
Support based on pivot points: 55,539, 55,393, and 55,157
Resistance based on Fibonacci retracement: 56,099, 56,810
Support based on Fibonacci retracement: 55,266, 54,845
The NiftyBank also formed a bullish candle on the daily timeframe, negating the lower highs-lows formation of the previous four consecutive sessions. It almost filled the gap-down of June 13, which is considered a positive signal. The index climbed above the 20-day EMA and the midline of the Bollinger Bands. However, the Bank Nifty maintained a negative crossover on the Moving Average Convergence Divergence (MACD), with a further weakening histogram. The RSI held steady at 55.33, slightly above the 50 mark, and tilted upward, reflecting improving momentum.
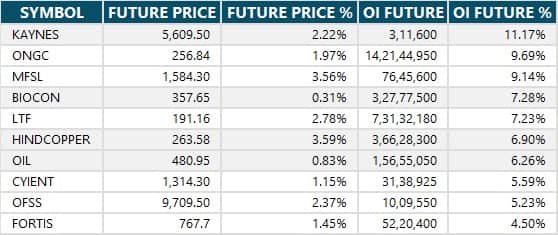
Long Build-Up, 132Stocks:
A long build-up was seen in 132 stocks. An increase in open interest (OI) and price indicates a build-up of long positions.
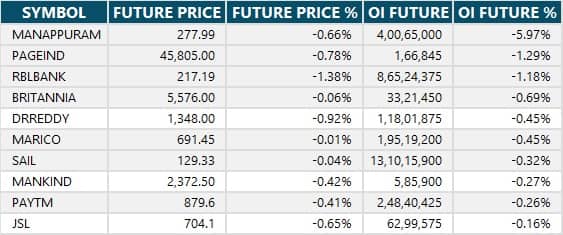
Long Unwinding, 11Stocks:
11 stocks saw a decline in open interest (OI) along with a fall in price, indicating long unwinding.
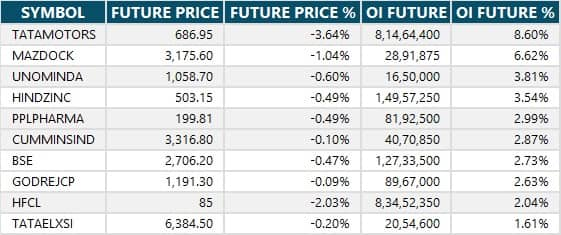
Short Build-Up, 17 Stocks
17 stocks saw an increase in OI along with a fall in price, indicating a build-up of short positions.
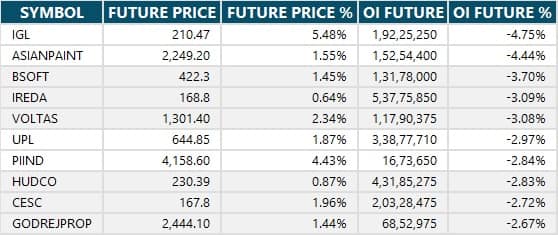
Short Covering, 64 Stocks:
64 stocks saw short-covering, meaning a decrease in OI, along with a price increase.
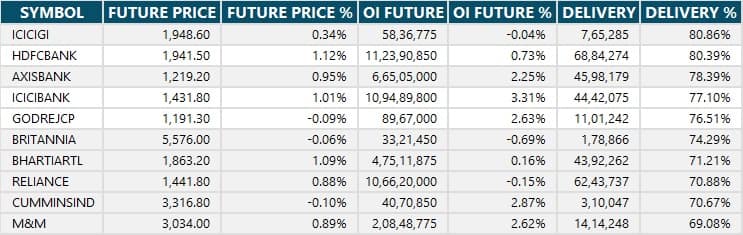
High Delivery Trades
Here are the stocks that saw a high share of delivery trades. A high share of delivery reflects investing (as opposed to trading) interest in a stock.
Report by Sunil Shankar Matkar


No comments:
Post a Comment