

Asset-Light Strategies Driving Extraordinary Capital Efficiency
Most investors hunt for fast growth. Yet some of the steadiest money is made by dull businesses that need little capital, throw off a lot of cash, and hand most of it back to shareholders. Two Pharma companies fit that description almost perfectly today. Both earn a return on capital employed (ROCE) of more than 80%, which is very rare.
For context, the wider industry earns a ROCE of about 15% and pays a one-year dividend yield of roughly 0.09%. Against that, our two names look unusual. The first posts a ROCE of about 84% and a yield near 2%. The other posts a ROCE of about 90% and a yield close to 1.6%. Both beat the sector on the two numbers that matter most to a cash-focused investor.
There is a simple reason for this. Neither runs a heavy, factory-led business. They sell well-known consumer health brands, keep very little money tied up in fixed assets, and pay most of their profit out as dividends. A healthy operating profit divided by a small capital base produces a very high ROCE. That is the story in one line. The rest of this piece checks whether it holds up once you read the fine print.
#1 P&G Health: A Brand Cabinet Most Indians Already Own
P&G Health Ltd is part of the Procter & Gamble group, which holds about 52% of the company. It is one of India’s largest producers of vitamins, minerals and supplements.
With a market cap of around Rs 10,329 cr, the company makes products like Evion, Neurobion, Seven Seas, Nasivion, Polybion Livogen etc. These are old, trusted names, and that is the quiet pricing power that makes a brand business durable.
The Dividend Payout Framework: Capital Extraction Outperforming Annual Net Profit
This is where P&G Health stands apart. The company has a dividend yield of about 2%, against the industry median of just 0.09%. But the headline understates the generosity. Over the trailing twelve months the company paid Rs 205 per share, made up of a Rs 110 interim and a Rs 50 special in February 2026, plus a Rs 45 final earlier.
At the current price that is a trailing yield above 3%. Screener.in also shows a dividend payout that has run above 100% of profit in several recent years, meaning the company returns more than it earns by drawing on its cash pile. It has paid dividends for more than two decades. For an income-minded investor, that record is the main attraction.
Navigating P&G Health’s Skewed Trailing Disclosures
P&G Health has changed its financial year twice. It moved from a December close to a June close, with an 18-month stretch ending June 2020, and then to a March close, with a 9-month stub ending March 2025. That makes a clean five-year growth rate misleading, since you end up comparing periods of different lengths. So, I am showing the actual yearly figures rather than a single number that would flatter or fool.
| Financial Year | FY21 (Jun) | FY22 (Jun) | FY23 (Jun) | FY24 (Jun) | FY25* (9m) | FY26 (Mar) |
| Sales (Rs cr) | 1,009 | 1,114 | 1,230 | 1,151 | 934 | 1,408 |
| EBITDA (Rs cr) | 246 | 268 | 325 | 307 | 319 | 457 |
| Net Profit (Rs cr) | 177 | 193 | 229 | 201 | 234 | 327 |
Read across the full years and the trend is clear. Operating profit has roughly doubled, from Rs 246 cr in FY21 to Rs 457 cr in the year to March 2026, and net profit has grown from Rs 177 cr to Rs 327 cr. That is healthy, margin-led growth. Sales, though, have crawled. Screener even shows five-year sales growth of under 1%, but that figure is distorted by the 18-month year in the base.
A fair takeaway would be that profit has compounded in the low teens while the top line has been sluggish. This company grows earnings through better margins and cost control, not rapid sales gains.
The share price of Procter & Gamble Health Ltd was around Rs 5,800 in June 2021 and as of closing on 10th June 2026 it was Rs 6,224.
P&G Health Long-Term Price Chart
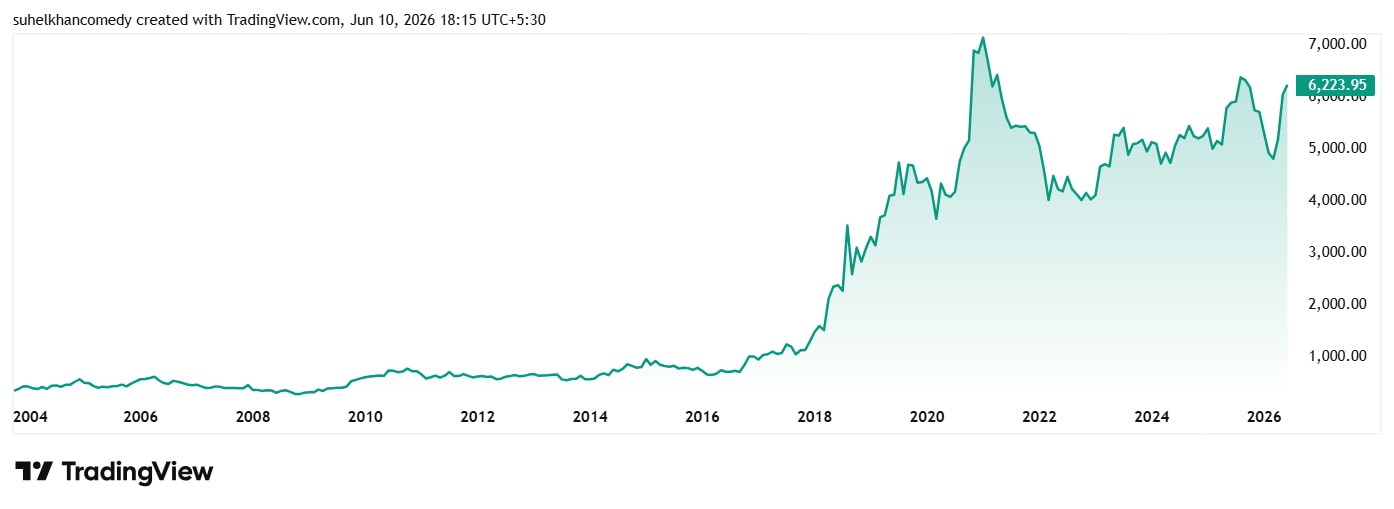
On valuation, the stock trades at a price-to-earnings (PE) ratio of about 32x, which is same as the current industry. A caution on the longer view: a clean ten-year median PE is hard to trust here. The same year-end changes, plus a one-off gain of about Rs 768 cr in 2018, distort the historical earnings series. I would rather flag that than hand in a tidy but unreliable number.
Asset-Light Operational Mechanics: Breaking Down P&G’s 84% ROCE
P&G Health’s ROCE for the year to March 2026 is about 84%, and its return on equity is about 62%. In plain words, for every Rs 100 of capital the company uses, it earns roughly Rs 84 of operating profit. This is while its peers from the industry average about 15%.
The company keeps little money locked up, runs on a slim asset base, and pays most of its profit out as dividends, which keeps its equity small. A small base under a solid profit produces a very large ratio. The business is a good one, but the eye-popping figure is partly an effect of how little capital it retains.
#2 Sanofi Consumer Healthcare: Two-Year-Old Company with Decades-Old Brands
Sanofi Consumer Healthcare India was incorporated only in 2023. It was carved out of Sanofi India through a demerger to create a standalone consumer health business, and listed soon after. The company is new, but the brands are not. It owns Allegra for allergy relief, Combiflam for pain, Avil, and DePURA for vitamin D. These are household names, which is the whole point of an over-the-counter consumer health business.
With a market cap of Rs 10,791 cr, the company operates across a range of channels, including distributors, wholesalers, government institutions, hospitals, pharmacies, pharmacy chains, and e-commerce platforms. It also has various independent third-party manufacturers.
One number stands out on the shareholding page. Promoter holding rose from 60% in March 2025 to over 71% in March 2026, as the Sanofi parent raised its stake. When the owner of a business buys more of it, investors usually take notice. Over the same period, foreign and domestic institutions trimmed their holdings, so the float that the public can trade has shrunk.
Asset-Light Operational Mechanics: Demystifying P&G’s 84% Return on Capital Employed
Now, the 5-year figures for the company would not be of much use, as it was formed recently and it has not existed long enough as a separate entity. However, here is the most recent full year against the one before, built from the quarterly results (Source: Screener.in).
| Period | FY25 (Apr 24 to Mar 25) | FY26 (Apr 25 to Mar 26) | % Growth |
| Sales (Rs cr) | 676 | 935 | 38% |
| EBITDA (Rs cr) | 253 | 334 | 32% |
| Net Profit (Rs cr) | 168 | 258 | 54% |
These are full years built from quarterly filings. Operating margin has held in a strong 35% to 39% band. This is fast growth, and the December 2025 quarter was strong, with sales up about 47% and net profit up about 50% over the year before. But the base is short and shaped by the demerger, so we would treat one or two years as a starting point, not proof of a long trend.
The share price of Sonafi Consumer was about Rs 4,900 when listed in September 2024 and as of closing on 10th June 2026 it was Rs 4,675 which is a considerable drop. The stock is currently trading at a discount of about 22% from its all-time high of Rs 5,954.
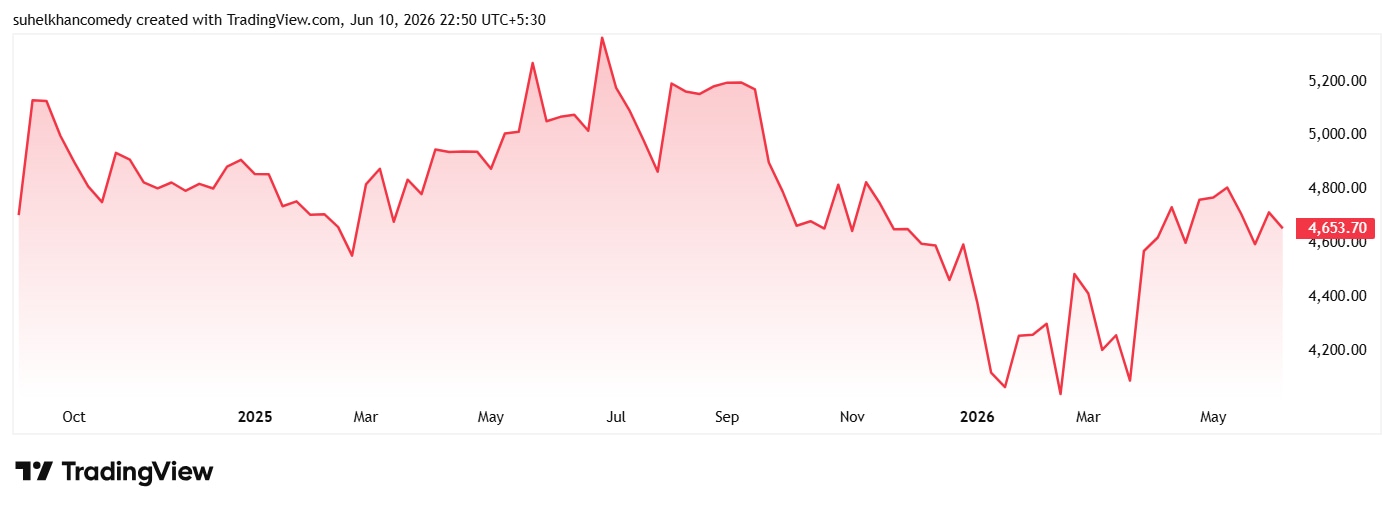
Sanofi Consumer Healthcare Long-Term Price Chart
On valuation, the stock trades at a PE of 43x against the current Industry median of 32x, hence trading at a small premium to the sector’s median.
The risks are the short trading history, the thin float after the promoter buying, the steep multiple on book value, and the auditor change. The pull is a portfolio of strong brands, almost no debt, the highest ROCE in the pair, and a rising dividend.
Valuation Premiums vs. Capital Yields: Sanofi’s 90% ROCE Against Its Trading History
Sanofi Consumer is the more extreme of the two on returns. Its ROCE is about 90% and its return on equity about 72%. So, for every Rs 100 of capital employed, it produces about Rs 90 of operating profit, while industry peers average about 15%. As with P&G Health, that is partly a sign of how little capital the business needs, not just how well it runs, and the short history gives the ratio less to stand on.
Regarding dividends, Sanofi Consumer yields about 1.6%, which still beats the sector. It paid a Rs 55 final dividend in April 2025, and the board has recommended a much larger Rs 75 per share final dividend, with a record date in June 2026. That is a clear step up.
One item deserves a plain mention. The company’s auditor, Kalyaniwalla & Mistry LLP, resigned at the end of April 2026 over what was described as a fee dispute, and PwC was appointed in its place in May. An auditor change is not, by itself, a red flag, and the stated reason was fees. But any auditor change at a newly listed company is worth watching, and I would rather point it out than skip past it.
Balancing Consistent Dividend Inflows Against Growth Frontiers
Both companies are real cash machines and they own brands people buy without thinking, carry almost no debt, earn far more on their capital than the sector does, and pay out more in dividends than most peers. For an investor who wants steady income and quality, that is a rare and appealing mix.
But the same features that make the ROCE look stunning also set the limits. These businesses are high return precisely because they keep so little capital and pay so much out, which leaves less to reinvest for growth. P&G Health has grown profit nicely, yet its stock has been flat for five years, a reminder that the price you pay matters as much as quality. Sanofi Consumer is growing faster, but it is young, lightly traded, and has just changed its auditor. Neither is a bargain on book value.
However, these are not get-rich-quick stories. They are slow, cash-rich, dividend-led businesses where the main risk is overpaying for the comfort they offer. For a watchlist For a watch list built on quality and income, both earn a place. Whether today’s price is the right entry is the question each reader will have to answer.
Article written by Suhel Khan
Source: FinancialExpress
Disclaimer:
Note: We have relied on data from http://www.Screener.in and http://www.trendlyne.com throughout this article. Only in cases where the data was not available, have we used an alternate, but widely used and accepted source of information.
The purpose of this article is only to share interesting charts, data points and thought-provoking opinions. It is NOT a recommendation. If you wish to consider an investment, you are strongly advised to consult your advisor. This article is strictly for educative purposes only.
Suhel Khan has been a passionate follower of the markets for over a decade. During this period, he was an integral part of a leading Equity Research organisation based in Mumbai as the Head of Sales & Marketing. Presently, he is spending most of his time dissecting the investments and strategies of the Super Investors of India.
Disclosure: The writer and his dependents do not hold the stocks discussed in this article. The website managers, its employee(s), and contributors/writers/authors of articles have or may have an outstanding buy or sell position or holding in the securities, options on securities or other related investments of issuers and/or companies discussed therein.


No comments:
Post a Comment