

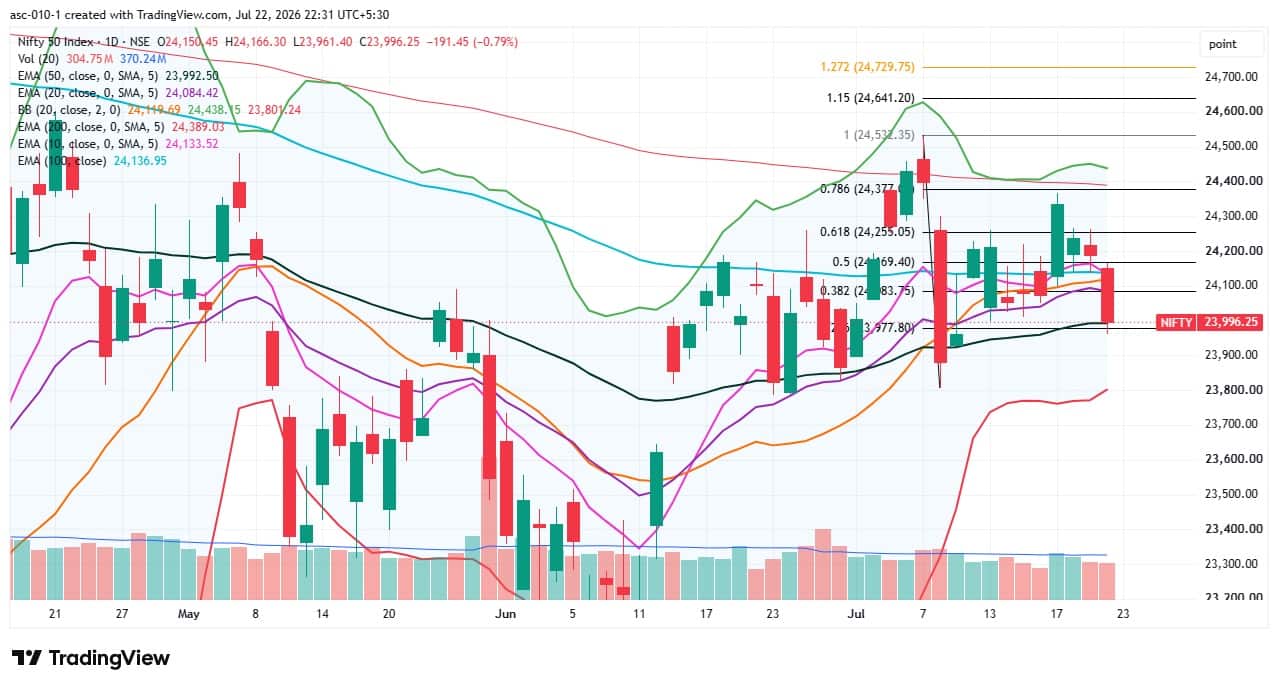
The Nifty 50 succumbed to selling pressure, declining 0.8 percent to end just below the psychological 24,000 mark on July 22, as escalating Middle East tensions lifted oil prices to $95 a barrel. Momentum indicators signal short-term weakness in the market. The index also slipped below its short-term moving averages and the midline of the Bollinger Bands, indicating that bears are in a stronger position. If the index sustains below the 24,000 level, a fall towards 23,800 cannot be ruled out. A breach of that level may allow bears to tighten their grip on the market further. However, in the event of a rebound, the 24,100-24,200 zone is likely to act as a hurdle, according to experts.
1)Levels For The Nifty50(cmp23,996)
Resistance based on pivot points: 24,120, 24,168, and 24,246
Support based on pivot points: 23,963, 23,915, and 23,836
Special Formation: The Nifty 50 formed a long bearish candle on the daily charts after a period of consolidation and slipped below its short-term moving averages, the 100-day EMA, as well as the midline of the Bollinger Bands, reflecting bears gaining an upper hand. The RSI dropped to 48.61 and witnessed a negative crossover, while the MACD slipped further below the signal line, with the red bar in the histogram expanding further, indicating strengthening bearish momentum.
2) Key Levels For NiftyBank (cmp57,127)
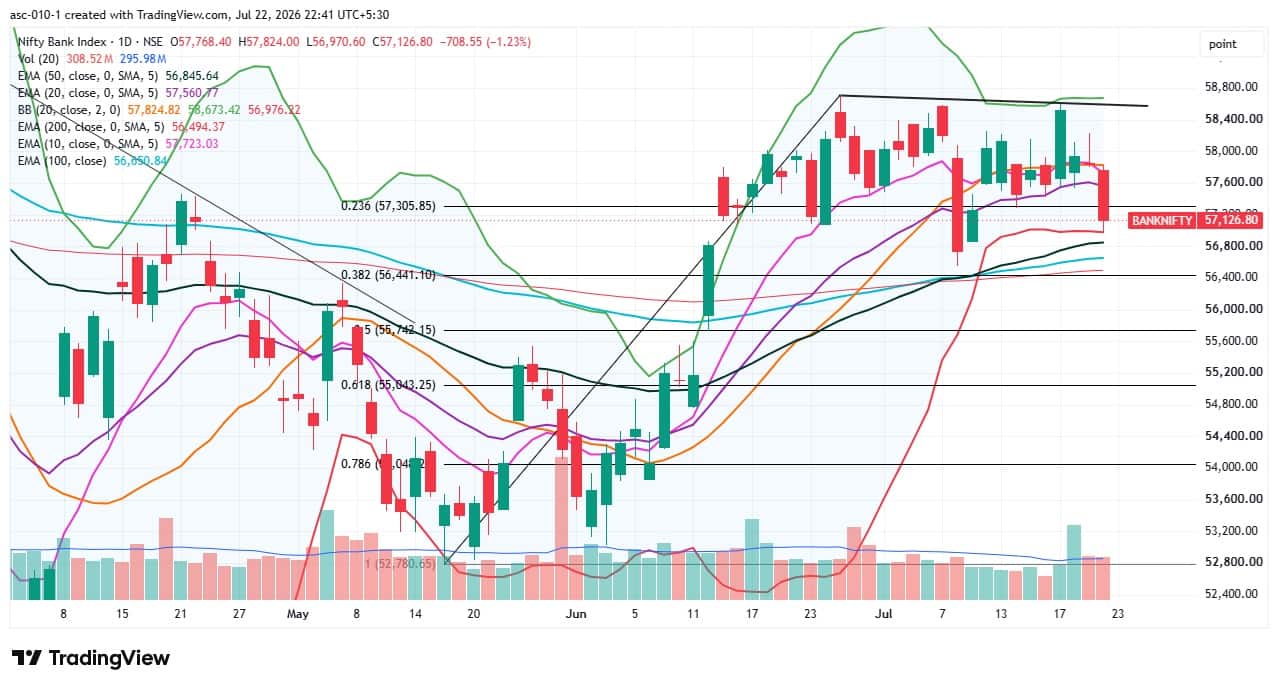
Resistance based on pivot points: 57,633, 57,835, and 58,161
Support based on pivot points: 56,981, 56,780, and 56,454
Resistance based on Fibonacci retracement: 59,195, 61,717
Support based on Fibonacci retracement: 56,441, 55,742
Special Formation: The Bank Nifty declined 1.2 percent, breaking below the consolidation range of the past several sessions. It formed a long bearish candle on the daily charts, indicating increasing selling pressure. The banking index slipped decisively below its short-term moving averages and the midline of the Bollinger Bands, although it remained above its medium- and long-term moving averages. The RSI fell to 48.1 and continued to indicate a bearish crossover, while the MACD remained below the reference line, with the red bar in the histogram expanding, indicating weakness in the short term.
3) Nifty Call Option data:
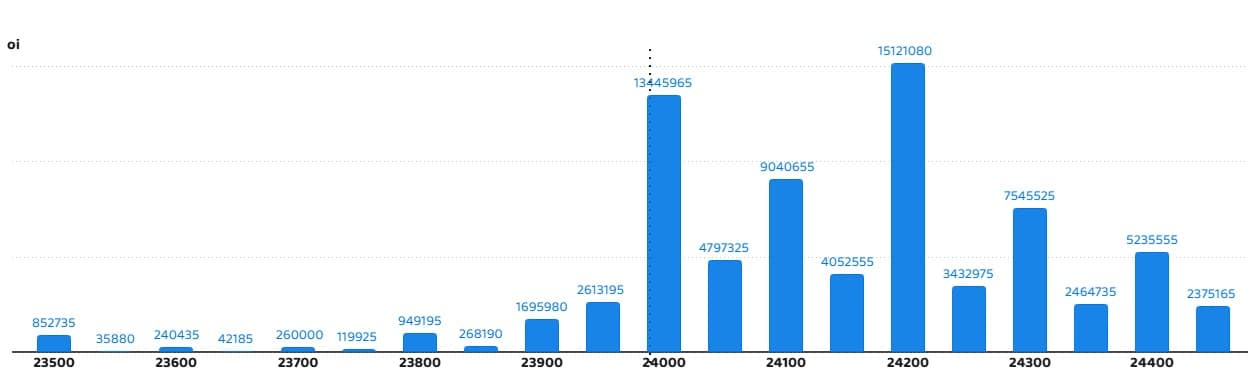
According to the monthly options data, the maximum Call open interest was seen at the 24,200 strike (with 1.51 crore contracts). This level can act as a key resistance level for the Nifty in the short term. It was followed by the 24,000 strike (1.34 crore contracts) and 24,100 strike (90.4 lakh contracts).
Maximum Call writing was observed at the 24,000 strike, which saw an addition of 87.3 lakh contracts, followed by the 24,100 and 24,050 strikes, which added 53.67 lakh and 45.69 lakh contracts, respectively. There was hardly any Call unwinding seen in the 23,500-24,450 strike band.
4) Nifty Put Option data:
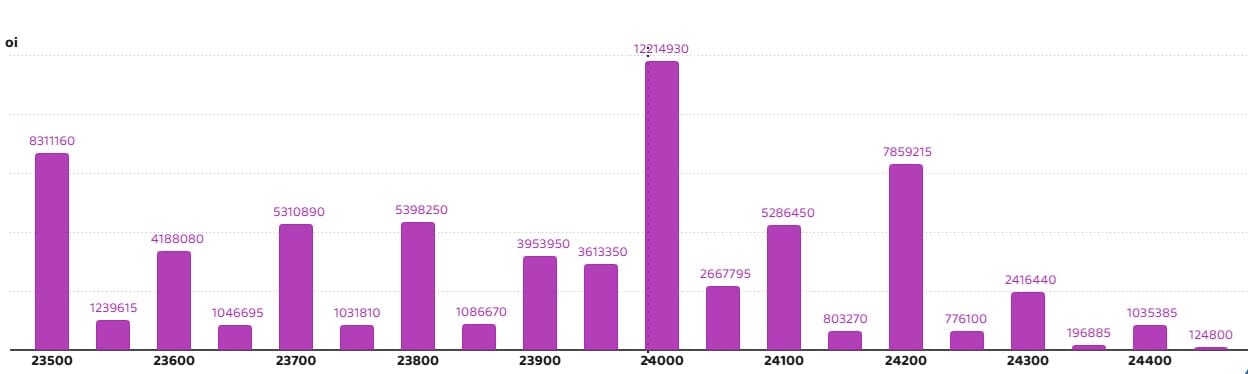
On the Put side, the 24,000 strike holds the maximum Put open interest (with 1.22 crore contracts), which can act as a key level for the Nifty in the short term. It was followed by the 23,500 strike (83.11 lakh contracts) and the 24,200 strike (78.59 lakh contracts).
The maximum Put writing was placed at the 24,000 strike, which saw an addition of 46.01 lakh contracts, followed by the 23,950 and 23,500 strikes, which added 26.49 lakh and 21.8 lakh contracts, respectively. The maximum Put unwinding was seen at the 24,200 strike, which shed 15.4 lakh contracts, followed by the 24,150 and 24,300 strikes, which shed 3.81 lakh and 3.08 lakh contracts, respectively.
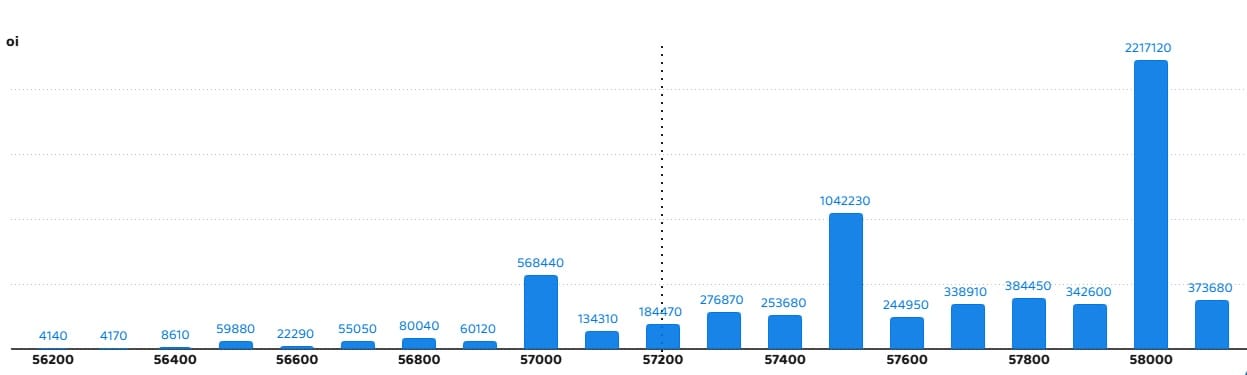
5) Nifty Bank Call Option dats:
According to the monthly options data, the maximum Call open interest was seen at the 58,000 strike, with 22.17 lakh contracts. This can act as a key resistance level for the index in the short term. It was followed by the 57,500 strike (10.42 lakh contracts) and the 57,000 strike (5.68 lakh contracts).
Maximum Call writing was observed at the 57,500 strike (with the addition of 6.44 lakh contracts), followed by the 58,000 strike (3.22 lakh contracts) and 57,300 strike (2.27 lakh contracts). There was hardly any Call unwinding seen in the 56,200-58,100 strike band.
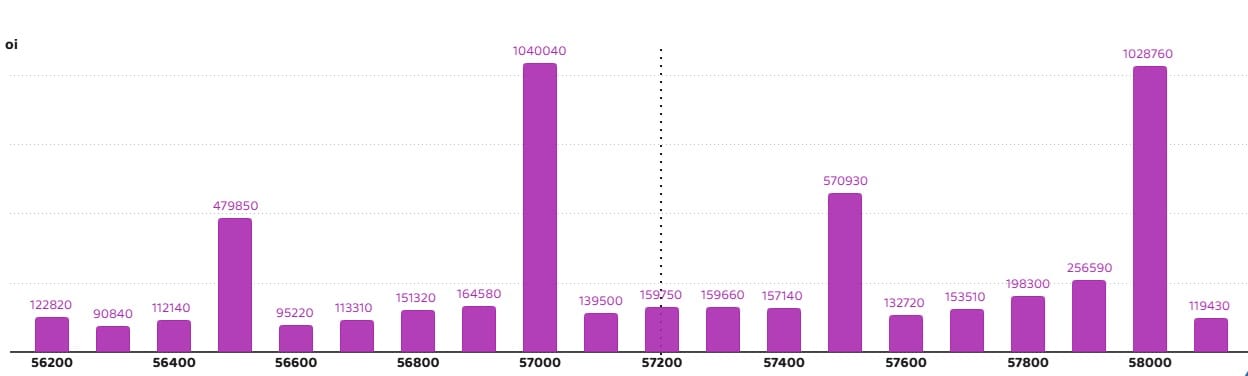
6) NiftyBank Put Option data :
On the Put side, the 57,000 strike holds the maximum Put open interest (with 10.4 lakh contracts), which can act as a key support level for the index in the short term. This was followed by the 58,000 strike (10.28 lakh contracts) and the 57,500 strike (5.7 lakh contracts).
The maximum Put writing was placed at the 57,000 strike (which added 2.29 lakh contracts), followed by the 56,900 strike (80,160 contracts) and 57,300 strike (57,570 contracts). The maximum Put unwinding was seen at the 58,000 strike, which shed 3.35 lakh contracts, followed by the 56,500 and 57,500 strikes, which shed 2 lakh and 1.64 lakh contracts, respectively.
Report by Sunil Sankar Matkar
Source: Money control


No comments:
Post a Comment